Richard Gaughan, Contributing Editor
As anyone who has been caught in a rainstorm without an umbrella can testify, weather modeling and prediction are not exact sciences. Although the basic physics underlying atmospheric dynamics is relatively straightforward, complexity grows rapidly as the scale of the interactions increases. That is one reason why scientists are interested in investigating weather on other planets.
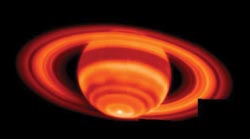
Researchers used the 10-m Keck I telescope to investigate temperature variations in the atmosphere of Saturn. This mosaic combines 35 exposures of the ringed planet and reveals a localized hot spot at the south pole.
The advanced technology of the 10-m Keck I telescope on Mauna Kea in Hawaii, combined with the long-wavelength spectrometer, recently made it possible to measure temperature variation in the atmosphere of Saturn. As they report in the Feb. 4 issue of Science, Glenn S. Orton and Padma A. Yanamandra-Fisher of the Jet Propulsion Lab in Pasadena, Calif., spent six hours last year using the instrument to collect snapshots of Saturn.
The spectrometer is based on a 128 × 128 Si:As blocked-impurity-band array that is sensitive to wavelengths from about 4 to nearly 26 μm and that can produce a 10.8 × 10.8-arc-sec image. The researchers stitched these images together to produce mosaics of the visible surface of the ringed planet with a 3000-km resolution. Images taken with five bandpass filters centered on wavelengths from 8.0 to 24.5 μm provided information about different layers in the saturnian atmosphere.
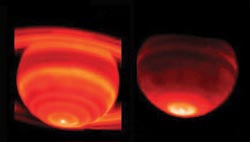
False-color infrared images of the polar region of Saturn illustrate the hot spot. The feature may be the result of the trapping of light-absorbing particles by a vortex similar to those at Earth’s poles.
After the data was processed, they generated two thermal maps of the planet. One represents the troposphere, close to the surface, and the other shows the temperature profile of the stratosphere.
The researchers found that Saturn is warmest at its south pole. Considering that they collected the images just after the planet’s long summer, during which the pole had been illuminated by sunlight continuously for 15 years, that is not unexpected.
Surprisingly, however, they found that the temperature rises in distinct steps, rather than increasing smoothly toward the pole. At approximately 70° south latitude, for example, there is a jump of a few degrees centigrade. At the pole, there is another discrete jump.
One possible explanation is that Saturn’s polar regions feature vortices similar to those seen on Earth. If light-absorbing particles are trapped in such a vortex, they could be responsible for both the observed temperature profile and a darkening in the visible images of the southern polar clouds. Future observations with the composite infrared spectrometer on NASA’s Cassini orbiter are expected to offer greater insight into the phenomenon.