For use as replacements for conventional lighting, LEDs have unique properties that require special testing equipment.
Thomas Attenberger, Instrument Systems GmbH
Advances in technology have made it possible for LED light sources to replace conventional lighting for such uses as automotive lighting and backlighting for liquid crystal displays. Such applications have stringent requirements to guarantee quality — for example, good homogeneity of color and intensity — when large numbers of LEDs are used. Accurate optical measurements are increasingly important for LED manufacturers and users to meet these demands.
Several technologies exist for testing LEDs. However, the unique optical properties of LEDs, such as their narrowband spectral power distribution, make special demands of the testing equipment.
Photometers and colorimeters, based on silicon diodes equipped with V(λ) or tristimulus color filters, are not optimal. The matching of these filters to the theoretical transmission functions is usually optimized for broadband light sources, where they may be used with sufficient accuracy. However, unavoidable deviations from the theoretical curves at the boundaries of the visible range can produce large measurement errors for blue and red LEDs.
On the other hand, spectrometers acquire the complete emission spectrum and can be used effectively in LED testing. Spectrometer technology comprises two types: scanning and array. Scanning spectrometers offer superior optical performance and are often found in reference and calibration laboratories, but they are not appropriate for production testing because they are slow to acquire spectral data. The majority of spectrometers used in LED testing, therefore, are the array type, which allows capture of a complete spectrum within a few milliseconds.
A large selection of array spectrometers exists, but only a few are designed to meet the special demands of LED testing. Depending on the optical design and the components of the spectrometer, the accuracy and reliability of the results it can achieve with LEDs can vary significantly. The main design characteristics necessary for the measurement of LEDs are spectral resolution, stray-light performance and dynamic measuring range.
Spectral resolution
The spectral resolution, or bandwidth, of a spectrometer leads to a broadening of the spectrum. Because the photometric values usually used to characterize LEDs are calculated from the complete visible spectrum, any distortion of the spectrum will result in measurement errors. For example, the measured spectrum of an LED is always different from the real spectrum, and this deviation causes errors in measurements: A bandpass of 10 nm produces an error of almost 1 nm in the dominant wavelength.
The better the spectral resolution — i.e., the smaller the bandpass — the less the spectrum is broadened, which might lead one to conclude that small-bandpass spectrometers are preferable. However, reducing the bandpass also reduces sensitivity, so the bandpass must be optimized for certain applications. Because most LEDs have a full width half maximum of 20 nm or more, the optimum bandpass is in the range of 2 to 3 nm. A smaller bandpass will not effectively improve the results but will decrease sensitivity.
Stray-light performance
Stray light results from diffuse and specular internal reflections in the monochromator. This leads to a redistribution of intensity from spectral regions that have high intensity to those that have lower intensity. This can be demonstrated by measuring the spectrum of a halogen lamp that has a 455-nm cut filter by three spectrometers with different stray-light performance (Figure 1, bottom). Because of stray light, the actual measured light level around 400 nm is far higher than might be expected from the filter transmission (10–6 at 400 nm). The better the stray-light performance of a spectrometer, the lower the light level in the blocking region of the filter.
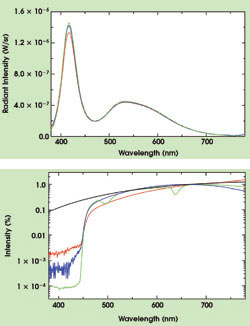
Figure 1. Three spectroradiometers that exhibit various stray-light performances measure the spectrum of a white LED (top). The relative intensity of the peak in the blue is reduced with increasing stray light. A test of stray-light performance with three devices produces curves that show the spectrum of a halogen lamp without (black curve) and with a 455-nm cut filter?(bottom). The signal in the blocking region of the filter is caused by stray light.
To learn how this effect influences the color results, especially when measuring white LEDs, it is important to look at the calibration procedures for spectroradiometers. In general, they are calibrated using a broadband white light source such as an illuminant A source that has its maximum energy in the near-IR. Because of stray light, energy from the IR region adds to the real intensity in the blue. This additional energy makes the measured signal in the blue region higher than the actual signal, as compared with the calibration lamp. And because the intensity in the blue region is only about 10 percent of the peak intensity, a stray-light level of 1 percent produces a calibration error of 10 percent.
As long as the light sources to be measured have a broadband spectrum similar to the calibration lamp, no large errors are expected. However, white LEDs have no IR peak to increase the signal in the blue. Processing the raw measurement data with the calibration curve will result in an underestimation of the intensity of the blue peak (Figure 1). The different weighting of the blue and yellow peaks will cause significant errors in the calculation of the color coordinates.
Dynamic measuring range
The dynamic measuring range, which is the ratio of the maximum signal level to the background noise level, results from the electronic and optical properties of the system. The electronic dynamic range depends on the resolution and accuracy of the analog-to-digital converter and on the signal-to-noise ratio of the detector.
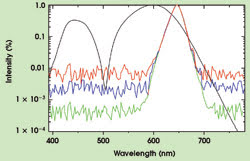
Figure 2. The spectra of a red LED show different dynamic measuring ranges. The black line represents the x(λ) tristimulus function.
Measurements of a red LED in Figure 2 demonstrate the influence of the dynamic measuring range. The higher the noise level, the larger the errors in the color results will be. For example, a spectrometer with a dynamic measuring range of only two orders of magnitude leads to a measurement shift of almost 14 nm in the dominant wavelength.
To achieve high-quality LED measurements, spectroradiometers should have a dynamic measuring range of more than three orders of magnitude. This requires choosing both a carefully designed monochromator and a detector with a high dynamic range. For array spectrometers used in production testing, this can be found only with cooled back-illuminated CCD array detectors.
Spectroradiometers are a good choice for optical measurements of LEDs. However, the accuracy of measurement results can be strongly affected by the properties of the device used. Accurate results require a high-quality spectroradiometer, such as a scanning spectrometer or a high-end array spectrometer with a back-illuminated CCD detector.
Meet the author
Thomas Attenberger is product manager of LED testing at Instrument Systems GmbH in Munich, Germany; e-mail: [email protected].