Inexpensive device is based on wavelength-dependent bending loss in fiber.
Breck Hitz
There are many occasions in telecom, optical sensing and other applications when it is necessary to measure the spectral parameters of an unknown signal. Techniques of varying sophistication are used to carry this out in optical spectrum analyzers, wavelength meters and heterodyne instrumentation. But often it’s sufficient to measure just the wavelength of a stable, monochromatic source, and recently researchers at Dublin Institute of Technology in Ireland have demonstrated a delightfully straightforward technique for doing that.
The technique measures an incoming wavelength using the wavelength-dependent bending loss of an optical fiber. The researchers placed two fibers side by side, one with a bending section and the other without (Figure 1). A 3-dB splitter divided incoming radiation between the two fibers, and the ratio of power transmitted through them was a function of the incoming wavelength. The device had to be calibrated with a tunable source whose wavelength was known, but once calibrated, it provided fast and accurate wavelength measurement with easy interconnection, good mechanical stability and low polarization dependence.
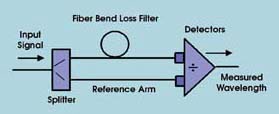
Figure 1. By measuring the magnitude of the wavelength-dependent loss in a bent fiber, the instrument provides a measurement of the incoming wavelength. Images reprinted with permission from Optics Letters.
In a proof-of-concept demonstration, the researchers designed a test instrument capable of operating over a wavelength range between 1500 and 1560 nm, which includes the important telecom wavelengths (i.e., almost all of the C-band and a good portion of the S-band). To demonstrate the instrument’s resolution, they adjusted the wavelength of a tunable laser in 10-pm steps and observed clearly distinguishable transmission ratios between the two arms at each step (Figure 2).
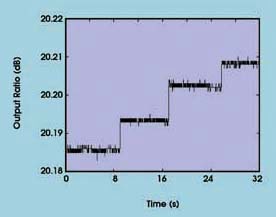
Figure 2. This plot shows the ratio of power in the two arms of the instrument in Figure 1, when a wavelength-tunable laser provided the input signal. The researchers adjusted the laser’s wavelength in ~10-pm steps every ~8 s, demonstrating a resolution of better than 10 pm for the instrument. (The minimum step of the tunable laser was 10 pm.)
The elements of the technique that are not so straightforward about the concept is the interdependence among the bending radius, the length of the bending section and the bending loss imposed on light transmitted through the fiber. Theoretically, the bending loss of a fiber with an infinite cladding will increase monotonically with decreasing bend radius. In practice, real fibers have finite claddings and additional protective layers outside the cladding, which makes the situation more complex. Whispering-gallery modes are excited in the various layers, which results in light bouncing around in the different layers, with some of it eventually returned to the core.
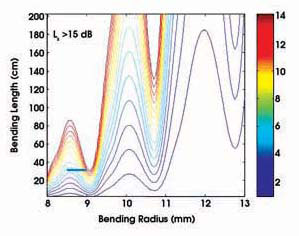
Figure 3. The contours in this plot are lines of constant bending loss at 1500 nm for a single-mode fiber (SMF28) with two protective coatings in addition to the cladding. For this fiber, bending loss does not monotonically increase with decreasing bend radius. For example, the heavy blue line in the lower left corner shows that, when a coil containing ~32 cm of fiber is loosened from an 8.5-mm-radius bend to a 9-mm bend, the bending loss increases from ~10 dB to ~14 dB.
The researchers previously analyzed this behavior with MatLab software from MathWorks of Natick, Mass., and found that the bending loss does not monotonically increase with decreasing bend radius (Figure 3). For their wavelength meter to work properly, they needed to find bend radius values and bending section lengths that create a bend loss that is monotonic as well as a nearly linear function of wavelength. Moreover, they needed bend-radius and -length values that provided this monotonic variation over a reasonable spectral range and with relatively low loss at the low end of the range.
To find these values, they charted the difference between bending loss at 1500- and 1560 nm (Figure 4). They chose a coil containing ~140 cm of fiber bent with a radius of ~10.8 mm. In their initial experiments, the fiber loss was monotonic with wavelength everywhere across the 1500- to 1560-nm range, but the curves were not sufficiently smooth or repeatable for reliable wavelength measurement.
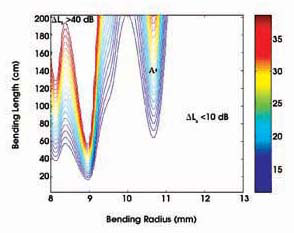
Figure 4. The contours in this plot are lines of constant difference between the bending loss at 1500 nm and that at 1560 nm. For the successful proof-of-concept demonstration, the researchers chose a coil containing ~140 cm of fiber bent with a radius of ~10.8 mm, as indicated by Point A in the plot.
Believing that the variation arose from random reflections at the interface between the fiber’s outer coating and air, the researchers added a strongly absorbing layer to the outside of the fiber. This coating defeated the random reflections and enabled the accurate, repeatable measurements indicated in Figure 2.
Optics Letters, June 15, 2006, pp. 1785-1787.