Electron-multiplying CCD cameras offer a new approach to quantitative biological microscopy.
Karl Garsha, Photometrics
An exciting development in light microscopy is the increasing availability of signal detection systems that record high-resolution emission spectra at each pixel in an image. These systems can be used for biological applications such as distinguishing the identities and relative contributions of fluorochromes with overlapping emission profiles.1
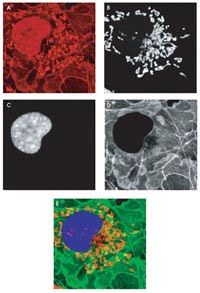
The image of a sample is shown using a conventional bandpass filter for red emission (A). The emission spectra of the fluorescent probes exhibit a high degree of overlap, making it difficult to discern protein localization in the context of cell anatomy. The segmentation of fluorescent probes is shown with distinct (but overlapping) spectral signatures using spectral imaging technology (B,C,D). The spectral components have been pseudocolored and overlaid to permit viewing of relationships between probe localizations (E).
In practice, spectral imaging methods are limited by the sensitivity, fidelity and stability of the data-acquisition hardware. For many years, laser point-scanning instruments based on photomultiplier tubes have been the most popular choice for acquiring spectral data from biological samples. This type of instrumentation affords excellent optical sectioning capabilities, albeit at the expense of overall light-collection efficiency.
An alternative class of instruments based on wide-field illumination and back-thinned electron-multiplying CCDs offers up to 60 percent greater quantum efficiency than instruments based on photomultiplier tubes. Because they are parallel acquisition devices as opposed to point-by-point serial scanners, back-thinned electron-multiplying CCDs allow light to be collected over a much longer integration time at each pixel — for a given frame rate — than is possible with devices based on photomultiplier tubes.
Not only do back-thinned electron-multiplying CCDs have improved photosensitivity, but they also have a wider dynamic range. These performance characteristics enable imaging at very low light levels, which is beneficial for studies using living specimens. The use of this CCD technology provides on-chip amplification of the signal above the read noise, thus permitting high-speed acquisition for better temporal resolution and reducing the possibility of photodamage to the sample.
Spectral imaging systems based on quantitative electron-multiplying CCD cameras that feature self-calibrating, stabilized, linearized gain as well as stabilized bias offset and extremely low noise floors are now available for life sciences research. This new instrumentation will provide significant advantages for live-cell image applications such as Förster resonance energy transfer (FRET) microscopy.
The advent of genetically encoded fluorescent protein pairs for FRET assays has enabled researchers to study many dynamic cellular processes. Because the resonance energy transfer phenomenon is dependent on nanometer-scale molecular interactions, alterations in the apparent FRET efficiency as recorded with fluorescence microscopy can be used to document close association between proteins in live cells.
Spectral overlap
Unfortunately, the most efficient donor-acceptor pairs for FRET measurements have a high degree of spectral overlap, thus confounding accurate analysis via conventional filter-based imaging systems. Spectral imaging and unmixing technology allows the successful use of FRET pairs with greater overlap, such as green/yellow fluorescent protein.2 Furthermore, because spectral unmixing can provide correction of the donor bleedthrough into the acceptor channel, postacquisition data manipulation can be streamlined as compared with conventional bandpass-filter-based determination.
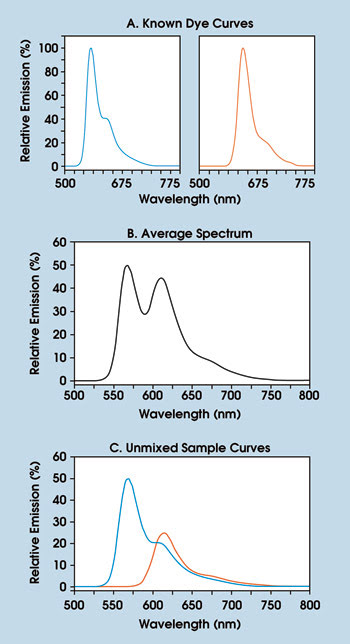
Unmixing of control-standard dyes reveals emission spectra from sample conditions (A). The average spectrum of the experimental sample is shown in B. The unmixed spectra show quantitative fluorophore contributions (C). The data was acquired using an MAG Biosystems SpecEM spectral imaging system.
When FRET occurs, conventional linear unmixing algorithms underestimate the abundance of donor molecules. In turn, the number of acceptor molecules is overestimated by a predictable amount. By using a spectral unmixing algorithm that accounts for the effects of resonance energy transfer on the intensity distribution of spectral components coming from mixtures of donor and acceptor molecules, spectral imaging and subsequent computational postprocessing can accurately measure donor and acceptor concentrations along with FRET efficiencies.3 This approach has been shown to provide results comparable to those with fluorescence lifetime imaging microscopy in a fraction of the acquisition time.
Recently, quantitative FRET techniques that combine spectral imaging and acceptor photobleaching have been reported.4,5 One such study demonstrated that by spectrally unmixing emissions before and after photobleaching, it is possible to resolve spectral bleedthrough and retrieve FRET efficiency/interaction distance quantitatively.4 This approach also provides the relative concentrations of the donor and acceptor.
Another of these studies used the stepwise partial bleaching method of acceptor molecules to reduce bleach exposure time considerably and to permit a series of measurements.5 Methods also were introduced to correct for the donor bleaching that can happen during the acceptor photobleaching process, thereby preventing underestimation of FRET efficiency.
Although these investigations used traditional devices based on photomultiplier tubes, spectral imaging techniques based on next-generation quantitative electron-multiplying CCD cameras are beginning to interest researchers. One particularly effective approach to spectral imaging via wide-field fluorescence microscopy employs a slit-aperture confocal illumination arrangement in which a one-dimensional strip of spatial information is recorded on one dimension of an electron-multiplying CCD array, and the dispersed spectral information is recorded across the second dimension.
This strategy allows the entire spectral range of the sample’s emission to be collected in parallel. By placing a slit aperture in the field plane, only the small portion of the sample being recorded is exposed to the excitation illumination. This setup prevents photobleaching of the sample during acquisition of the second spatial dimension of the field of view.
A confocal aperture placed near the exit port rejects scattered light from out-of-focus planes within thick samples. This technique can leverage the performance advantages of electron-multiplying CCD-based spectral imaging systems to further extend the utility of FRET as a research tool.
Meet the author
Karl Garsha is head applications scientist at Photometrics in Tucson, Ariz.; e-mail: [email protected].
References
1. M.E. Dickinson et al (December 2001). Multi-spectral imaging and linear unmixing add a whole new dimension to laser scanning fluorescence microscopy. BIOTECHNIQUES, pp. 1272-1278.
2. T. Zimmermann et al (Nov. 6, 2002). Spectral imaging and linear un-mixing enables improved FRET efficiency with a novel GFP2-YFP FRET pair. FEBS LETT, pp. 245-249.
3. C. Thaler et al (October 2005). Quantitative multiphoton spectral imaging and its use for measuring resonance energy transfer. BIOPHYS J, pp. 2736-2749.
4. Y. Gu et al (August 2004). Quantitative fluorescence resonance energy transfer (FRET) measurement with acceptor photobleaching and spectral unmixing. J MICROS, pp. 162-173.
5. V. Raicu et al (Jan. 1, 2005). Protein interaction quantified in vivo by spectrally resolved fluorescence resonance energy transfer. BIOCHEM J, pp. 265-277.