EMCCD detectors with three modes of operation provide the flexibility of detecting with the mode that is right for the signal level of the application.
Mayank Tripathi, Andor Technology
Since it was introduced to the analytical research industry, electron-multiplying (EM) CCD technology has been successfully employed in a variety of spectroscopy applications, and its use has led to dramatic improvements in signal-to-noise ratio (SNR). EM technology’s principal advantage is that it permits the detector to overcome the read noise limit, one of the biggest drawbacks in today’s CCD detectors.
EM technology improves sensitivity in situations where the detector is photon starved, where weak signals must be detected at high spectral rates, or where the excitation power must be reduced significantly to protect the sample from damage. However, the technology is not required for every application. Signals well above the read noise limit of the CCD detector are likely to benefit more from the use of a conventional CCD. Thus, it is important to understand the needs of the application and to make an informed choice when purchasing a detector.
The Newton range of EMCCDs made by Andor Technology provides the user with electron-multiplying capability while allowing maximum flexibility, depending on whether the signal strength is very weak or very strong. These detectors have three modes of operation: EM with gain on, conventional CCD and EM with gain off. Its ability to switch between EM and conventional modes allows the user to optimize the sensitivity of the camera according to the incoming signal and thereby to achieve the highest SNR possible.
Signal-to-noise ratio
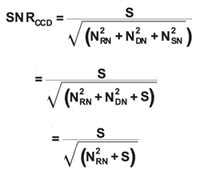
The decision to use a given mode of operation depends critically on the understanding of the concept of SNR because it defines the sensitivity of the detector. The SNR incorporates the total signal registered by the detector and considers all the components of noise associated with the detector. Typical calculations can be performed using the following steps, where S = incoming registered signal, NDN = dark noise, NRN = read noise, and NSN = shot noise. It is assumed that S equals the total signal falling on the sensor multiplied by the detector’s quantum efficiency, that shot noise equals the square root of S, and that, at –100 °C, NDN becomes negligible.
The basics
Typical CCD devices suffer from being limited by read noise. The faster the pixel read rate, the greater the read noise contribution; hence, the detector typically is run at slow rates to increase the sensitivity of the camera.
EMCCDs circumvent the increased read noise contribution when running at high read rates by applying gain to the charge and by amplifying the signal before the charge is read out. Donal J. Denvir and Emer Conroy1 have given a detailed description of the gain mechanism of EMCCD detectors.
The readout register of an EMCCD consists of two parts — the normal readout register and the gain register (Figure 1). Charge flows through the normal readout register during the conventional CCD mode of operation. Because this mode does not experience any signal-multiplication effects, its dynamic range remains 16 bits at all times; therefore, this mode of operation results in high responsivity for signals above the read noise contributed by the register’s readout amplifier.
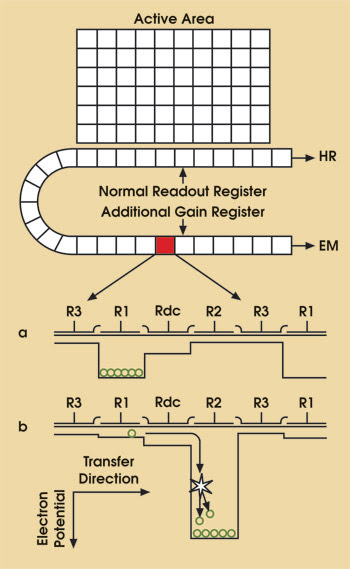
Figure 1. In this sketch of a full-frame EMCCD sensor, panels a and b depict the electrode potential structure embedded underneath the pixels of the additional gain register.
Charge that flows through the gain register passes through a series of pixels whose electrode structure is slightly modified compared with the readout register. In the gain register, there are two electrodes (Rdc and R2) rather than only the R2 electrode found in the readout register. The Rdc electrode is held at a fixed potential, and the R2 electrode is clocked as usual, except that the transfer through R2 occurs over a large voltage potential difference. This potential is large enough to create an intense electronic field that leads to the multiplication of the transferring electrons. This multiplication process is referred to as impact ionization.2
This charge multiplication process is probabilistic in nature.3 In the Newton cameras, each transfer results in an impact ionization probability of 1.29 percent at the highest gain limits. Because there are 536 transfers that take place in the EM gain register of these cameras, the ultimate cascaded gain (G) is ~1.0129536 (~1000). Hence, the EMCCD technology enables a gain of 1000 times at maximum gain levels.
Because this signal amplification takes place before the readout actually occurs, the read noise contribution remains the same for the given read rate, while the signal is amplified several times over. In relative terms, the read noise is rendered negligible, and the detector itself becomes free from read noise limits. It is essential to note that the EMCCD detector remains limited by shot noise, and that is the closest that today’s detector can get to becoming an ideal detector.
The gain process introduces a new element of noise called the noise factor (F), which is defined as follows:4
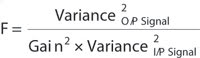
The stochastic multiplication processes create a change in the I/P and O/P variances and, hence, in F. The F values are empirical and vary between 1.6 and 2.2 for Gen II intensified CCDs and between 2 and 3.5 for Gen III intensified CCDs; for EMCCDs, this typically is found to be ~1.3 to ~1.4.4
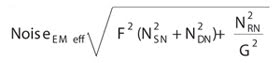
Considering the effect of the noise factor (F) and gain (G) (obtained as a result of cascaded multiplication in the gain register), the noise for an EMCCD detector in the EM mode can be written as:
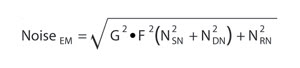
Alternatively, this term can be written as:
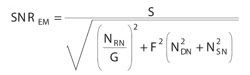
Hence, the SNR for EM mode can be written as:
As G values begin to increase, the term (Nrn G–1)2 approaches zero. Assuming that the dark noise component also becomes negligible at temperatures of about –100 °C, the SNR equation for EM becomes:
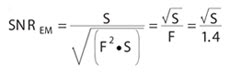
(assuming typical value for F = 1.4).
Based on the SNR calculations made above for the conventional and EM modes of operation, an estimate can be arrived at for determining the correct operating mode for the detector. It can be seen by comparing Equations 1 and 6 that for NSN ≤ NRN, SNREM > SNRCCD, whereas for NSN > NRN, SNRCCD > SNREM.
Thus, the EM gain benefits SNR in situations where the shot noise of the incoming photon signal is less than or equal to the read noise generated for the given pixel read rate. The graph in Figure 2 illustrates this statement by depicting the SNR curve versus the number of photons per pixel (photon flux) for a DU970N detector used in the EM and conventional modes. The SNR performance for an ideal shot-noise-limited detector also has been included for reference purposes. The data are based on the assumption that the sensor used has a 90 percent quantum efficiency in the spectral region used for observations.
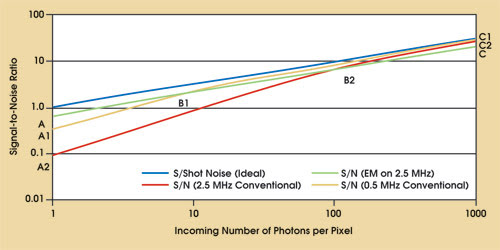
Figure 2. This graph illustrates the SNR curves versus the incoming photon signal for EM, conventional modes and for an ideal shot-noise-limited detector.
The ideal detector will have an SNR equal to the square root of the incoming photon flux (blue curve). The curve AB1B2C in Figure 2 represents the SNR curve in the EM mode running at 2.5 MHz (green curve), the curve A1B1C1 represents the SNR curve in the conventional mode running at 0.5 MHz (orange curve), and the curve A2B2C2 represents the SNR curve in the conventional mode running at 2.5 MHz (pink curve).
As seen, the SNR curves for the 2.5-MHz readout rate in the EM and conventional modes intersect at B2; that is, at 125 photons per pixel the SNRs of both curves is 7.5. For photon fluxes below this strength, the EM mode will have better SNRs than the conventional mode at 2.5-MHz readout.
It also can be seen that the conventional mode running at 50 KHz has a better SNR performance than when running at 2.5 MHz, as the readout amplifier contributes only 2 eÑ1 of read noise versus the 10 eÑ1 of read noise at a 2.5-MHz readout rate. Comparing this curve with the EM curve at 2.5 MHz shows an intersection at B1 where the SNR is 1.9 and photon flux is 8 photons per pixel. Hence, the EM mode of operation can provide better SNRs for less than 8 photons per pixel strength than the 50 KHz conventional mode of operation.
It is essential to note that the 2.5-MHz operation in the DU97ON model provides a rate of 600 spectra per second versus 30 spectra per second provided in the 50-KHz conventional mode. Besides, the user has the option of switching the mode operation as and when desired to ensure optimum SNR. Hence, applications with very low light conditions, such as Raman imaging/mapping and microfluorescence spectroscopy, which typically have been run using slow-scan detectors, now can be run at much higher spectral rates with improved SNRs.
The gain register has greater well-depth pixels than the normal readout register (Figure 1); i.e., 1.3 × 10⁶ e–1 well depth for the gain register pixels and 0.3 × 10⁶ e–1 well depth for the normal readout register. Hence, when the SNRCCD > SNREM, if the incoming signal is strong enough to saturate the readout register pixels in the conventional mode of operation, the user can acquire the data by operating the detector in the EM mode with the gain off. This will allow the charge to flow through the gain register and will use the extra well depth. Because the gain function remains off, the SNR will not be affected by the additional noise elements present in the EM mode with the gain on.
The spectra shown in Figure 3 depict the performance of the front-illuminated version of the DU970N EMCCD running at 50 KHz in both the EM and conventional modes observing acetaminophen after 785-nm laser excitation. A Raman probe made by InPhotonics Inc. of Norwood, Mass., was used to observe the Raman spectra. The laser power was 10 mW, and the exposure time was 5 ms. The two overlaid spectra show that, in the EM mode, the signal intensities become significantly amplified over the conventional mode. The SNR obtained for the peak at 411 pixel number in the EM mode is 18.7, whereas it was 5.7 in the conventional mode.
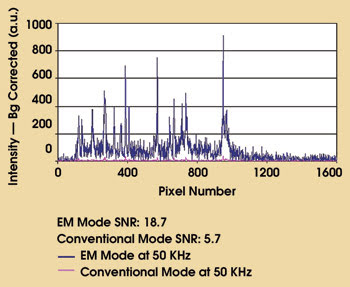
Figure 3. NIR Raman excitation spectra of acetaminophen were taken in EM and in conventional modes. A 785-nm laser was used for excitation, and the detector was run at 50 KHz with 5-ms exposure.
The acquisition conditions used were set to reproduce the theoretical phase wherein the EM-mode SNRs are expected to be higher than in the conventional mode. As expected, it is seen that the experimental results validate the theoretical outcomes.
The ability of these detectors to operate in EM mode for high sensitivity, in conventional mode for high responsivity, and in EM mode with the gain off for high-signal-strength situations is useful for many applications, including Raman mapping and microfluorescence spectroscopy as well as rapid particle identification and detection.
References
1. D.J. Denvir and E. Conroy (January 2001). Electron multiplying CCD technology: Application to ultrasensitive detection of biomolecules, Photonics West, Biomedical Optics (BiOS).
2. P. Jerram et al (2001). The LLCCD: Low-light imaging without the need for an intensifier, Proceedings of SPIE, Vol. 4306, pp. 178-186.
3. C.D. Mackay et al (2001). Subelectron read noise at MHz pixel rates, Proceedings of SPIE, Vol. 4306, pp. 289-298.
4. M.S. Robbins and B.J. Hadwen (May 2003). The noise performance of electron multiplying charge-coupled devices, IEEE Transactions on Electron Devices, Vol. 50, No. 5, pp. 1227-1232.