
Mapping microscale mixtures with FLIM
Lynn M. Savage
High-throughput research has become a driving force at pharmaceutical companies and other institutions where chemical and biological reactions must be checked and cross-checked to keep product development cycles moving swiftly and economically. Time is money, after all. But beyond the need for speed is the need to keep costs down, so high-throughput systems have been shrinking in size through the years.
An ongoing concern for developers of microfluidic systems is dealing with differences between macro- and microscale interactions. Solutions moving through tiny channels don’t have a lot of room to maneuver, and any molecules that they carry along can be hard to trace optically. Adding individual materials to a microfluidic system and mixing them in situ are even more difficult, possibly increasing the time while garnering results that are less reproducible than desired.
One way to simplify the process is to break up a solution into droplets, then perform the mixture step separately within each drop. Such microdroplet-based systems mix liquids and analytes quickly and without dispersion of the reagents used.
Now, Monpichar Srisa-Art, Andrew J. deMello and Joshua B. Edel of Imperial College London have taken the process a step further by using fluorescence lifetime imaging (FLIM) to evaluate the efficacy of the resulting mixtures.
Using two input streams, the scientists added a 10:1 v/v mixture of oil and water to a microfluidic device at a flow rate of 1.5 μl/min. In one stream, they added fluorescein 5-isothiocyanate (FITC) at 0.75 μl/min; in the other, they added rhodamine-110 chloride, also at 0.75 μl/min. The fluids passed along a serpentine channel that broke the solution into droplets at each bend. The markers were selected based on their significantly different lifetimes: FITC’s is 4.1 ns and rhodamine-110’s is 2.9, both at a pH of 9.
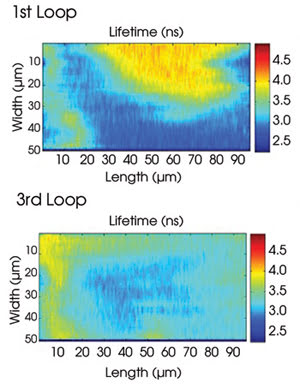
Two-dimensional maps show the progress of mixing fluorescent materials in aqueous droplets. Mixture uniformity becomes more pronounced as drops transverse the loops of a serpentine microfluidic chamber. Courtesy of Physical Review Letters.
As reported in the July 4, 2008, issue of Physical Review Letters, the researchers measured the fluorescence lifetimes of the FITC and rhodamine-110 at various points along the way, using a 438-nm laser operating at 20 MHz to excite the fluorescent markers and a time-resolved scanning confocal spectrometer to detect the resulting emissions.
After measuring the fluorescence emissions of hundreds of microdrops per experiment, they found that they could see fluorescence lifetime peaks drifting from z4 to 5 ms (correlating with a solution of pure FITC) down to times correlating to smooth multicomponent mixtures of FITC and rhodamine-110. They also found that they could create a 2-D representation of the mixing in progress by recording fluorescence lifetime measurements at 50 points along the winding microchannel, then mapping the fluorescence lifetime trajectories (see figure).
According to the researchers, the technique should facilitate high-throughput protein-folding studies and investigations of high-speed chemical reactions with submicrosecond temporal resolution.
Published: September 2008