Dr. Daniel Fried, University of California, San Francisco
Nondestructive polarization-sensitive OCT is likely to become a useful addition to the dentist’s armamentarium for assessing the depth and internal structure of lesions related to tooth decay. It also may be extremely valuable to dental researchers for assessing new anticaries agents.
Currently in the US, dental decay is often detected using visual/tactile methods coupled with radiography. These diagnostic and treatment paradigms were developed long ago and were adequate for the large-cavitated lesions that were prevalent at that time.
But the nature of dental decay has changed markedly over the past 50 years, thanks to the introduction of fluoride, and these methods do not have sufficient sensitivity or specificity for the types of lesions that are typically encountered now. New tools are needed to detect and monitor dental decay (caries) at the early stages of development.
Today’s carious lesions are of a more concealed nature: They penetrate deep into the tooth without forming a cavity – i.e., they maintain an intact surface. Radiographic methods do not have the sensitivity for these types of lesions, particularly occlusal lesions, and by the time the lesions are radiolucent, they often have progressed well into the dentin – at which point surgical intervention is necessary. At that stage in the decay process, it is far too late for preventive and conservative intervention, and a large portion of carious and healthy tissue will need to be removed, often compromising the mechanical integrity of the tooth.
However, the caries process potentially is preventable and curable. If carious lesions are detected early enough and before cavitation (cavity formation), it is likely that they can be arrested/remineralized by nonsurgical means through fluoride therapy or with dietary changes.
Demineralization causes an increase in the porosity of the tooth, which in turn increases the magnitude of light scattering, and lesions visible on the tooth surface appear whiter than the surrounding sound or normal enamel. During remineralization, the pores near the surface of the lesion are filled with mineral, reducing light scattering.
Therefore, optical diagnostics have great potential for the diagnosis of the current “state of the lesion” – i.e., whether the carious lesion is active and expanding or whether it has been arrested and is undergoing remineralization.
Optical coherence tomography (OCT) is ideally suited for imaging carious lesions because of the high transparency of enamel in the near-IR, and it is uniquely capable of nondestructive measurement of the internal structure of the lesion. Polarization-sensitive OCT (PS-OCT) has been used to show the formation of a transparent zone of increased mineral density and reduced light scattering at the lesion surface after remineralization therapy. A nondestructive, quantitative method of monitoring demineralization and remineralization in high-risk areas
of the tooth, such as the pits and fissures of tooth biting surfaces, would be invaluable for use in short-term clinical trials for various anticaries agents such as fluoride dentifrices and antimicrobials.
The first OCT images of hard tissue structures of the oral cavity and dental caries were acquired by Colston et al.1 Soon afterward, Baumgartner and collaborators presented the first polarization-resolved images of dental caries.2 In the same year, Feldchtein and colleagues presented the first in vivo OCT images of dental caries.3 These early measurements suggested that polarization sensitivity can be used to enhance the contrast of carious lesions. Later measurements using PS-OCT demonstrated that polarization sensitivity provides considerable advantages for the measurement of lesion severity and for tracking lesion progression.4
Most work involving PS-OCT has focused on measuring tissue birefringence and generating images of phase retardation.5 More sophisticated configurations also have been implemented to measure the Stokes parameters and the full Mueller matrix.5 Tooth enamel has a high refractive index (n = 1.63), so the high reflectance from the tooth surface can interfere with measurement of the lesion structure and severity. Upon demineralization, the light scattering of enamel in the near-IR increases by two orders of magnitude, and the strong scattering is effective in scrambling the initial polarization of the incident light. The strong reflection from the tooth surface is greatly reduced in the cross-polarization (CP) image or the image in the orthogonal polarization to the light incident on the tooth. Lesions also are visible with higher contrast in the CP-OCT image.
Figure 1 shows PS-OCT images of the occlusal pit of a premolar with a shallow lesion about 100 µm deep. The reflectivity from the surface of the tooth is greatly reduced, along with the reflectivity from the sound enamel, and the lesion appears with much greater contrast in the orthogonal polarization image (⊥).
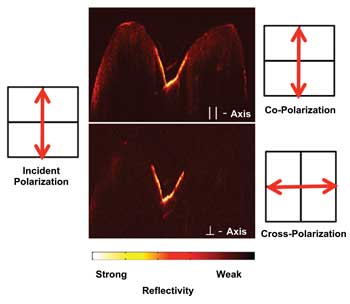
Figure 1. Two PS-OCT b-scans across the occlusal surface of a premolar tooth with demineralization in the fissure at the center of the occlusal surface are shown. The images are shown corresponding to the co-polarization (||) and cross-polarization images (⊥). Images courtesy of Dr. Daniel Fried.
The product of the lesion mineral loss and the depth provides a measure of the lesion severity, and studies have shown that the integrated reflectivity in CP-OCT images correlates with the mineral loss for early demineralization in enamel.6 Figure 2 shows a gray-scale OCT image of an enamel block after exposure to demineralization for different periods of time. A polarized light micrograph (PLM) and a transverse microradiograph (TMR) are shown for the corresponding tooth section for comparison. These techniques are the gold standard for measuring de-mineralization in teeth; however, they require histological sectioning and destruction of the tooth. CP-OCT measured differences in the depth and severity after each day of demineralization, nondestructively yielding similar information to that acquired by PLM and TMR. Another advantage of CP-OCT is that analysis of demineralization can be automated and algorithms applied to automatically identify the lesion’s depth and severity.7
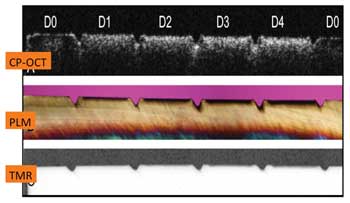
Figure 2. A cross-polarization OCT b-scan (gray-scale false color) across a block of enamel after sections were exposed to a demineralization solution for periods of zero, one, two, three and four days. The lesions’ depth and severity increase progressively from day zero (D0) to day four (D4).7 CP = cross-polarization; PLM = polarized light micrograph; TMR = transverse microradiograph.
To make a diagnosis and recommend intervention, it is not sufficient simply to detect a carious lesion or areas of demineralization; it also is necessary to assess the state of the carious lesion and to determine whether it is active and progressing or whether it is arrested and has remineralized. PS-OCT images of caries lesions show the highly convoluted internal structure, including the lesion body and surface zone; one of the most exciting applications of PS-OCT is measurement of the remineralization or repair of existing lesions.
Not only can PS-OCT measure decreased reflectivity resulting from increased mineral content that results from new deposits, but it also can acquire images of the outer layer of high mineral content that may form as the mineral is preferentially deposited in the outermost layer of the lesion.8,9 The presence of a substantial surface zone of reduced light scattering in the CP-OCT image indicative of remineralization may indicate the lesion is arrested – i.e., the surface zone of high mineral content blocks diffusion into the lesion body and prevents further demineralization, thus arresting the lesion.
Figure 3 shows PS-OCT images of another enamel block in which lesions approximately 100 µm deep were produced and subsequently exposed to a remineralization regimen for periods of up to 12 days. The growth of a transparent zone of enamel, approximately 40 µm thick, indicative of remineralization, can be clearly seen to develop after four days, along with an overall decrease in reflectivity of the lesions.
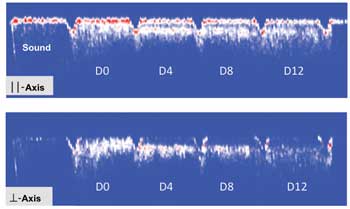
Figure 3. PS-OCT b-scans (red-white-blue false color) across a block of enamel with pre-existing lesions approximately 100 µm deep after being exposed to a remineralization solution for periods of zero, four, eight and 12 days. The sound enamel (no lesion) is shown in the leftmost window. A transparent surface zone ~40 µm thick forms on the surface of the lesion, and the reflectivity decreases progressively with exposure to the remineralization solution.8
Knowledge of the lesion depth is critical for helping dentists decide whether they should drill and fill or attempt to arrest the lesion with fluoride. Many lesions penetrate through the fissures and pits of the enamel down into the dentin and are not apparent from visual examination or on radiographs. They are called hidden lesions, and OCT has great potential for detecting many of them.
Hidden lesions typically spread laterally under the enamel because lesions progress more rapidly in the softer dentin than in the overlying enamel. One problem with imaging deeper lesions with OCT is that the strong scattering in the lesion itself attenuates the signal penetration, and, often, only the outer part of the lesion is visible. However, because most lesions spread laterally under the enamel, a strong reflection often can be resolved from the carious dentin under the surrounding sound enamel. The highly scattering (reflective) target under a transparent medium is an ideal situation for OCT, and this approach is demonstrated in Figure 4.
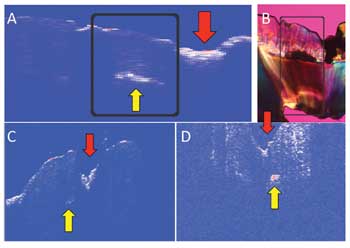
Figure 4. (A) OCT scan across the occlusal surface of an extracted tooth shows a region of demineralization extending from the tooth surface (red arrow) and an adjacent region where the lesion has spread under the dentin and where there is a strong subsurface signal (yellow arrow). The corresponding polarized light micrograph of the tooth section is shown in (B). Shown in (C) are similar images taken of two other teeth during an in vivo study.10
The red arrow in Figure 4A shows the center of the fissure, where strong reflectivity and a rapid loss of signal with depth indicate demineralization. Next to the fissure is a strong signal deep in the tooth where part of the lesion is present, with sound enamel above it (yellow arrow). Figure 4B shows a polarized light micrograph of a thin section cut from the tooth matching the OCT image, and the lesion (demineralized areas) appears black. My colleagues and I hypothesize that many hidden occlusal lesions can be detected by examining the pits and fissures for similar optical behavior. We examined 14 teeth with carious lesions in vivo, and 12 manifested this behavior. Figures 4C and 4D are in vivo OCT images of two of these teeth.10
Figure 5 shows in vivo images taken using a CP-OCT imaging system developed by Santec of Aichi, Japan, which incorporates a microelectromechanical systems scanner and the interferometer in the handpiece (Figure 5D). Putting the interferometer in the handpiece avoids the difficulties of working with polarization-maintaining fiber. We are currently carrying out three clinical studies using this CP-OCT imaging system. In one study, we are monitoring the development of demineralization around orthodontic brackets (Figures 5A and 5B).
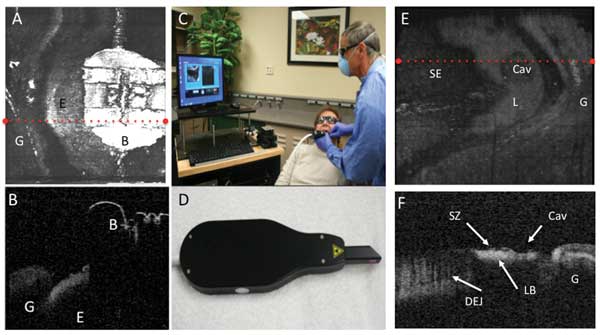
Figure 5. Images taken with the Santec CP-OCT scanner show a tooth with an orthodontic bracket. A surface rendering (A) and a b-scan extracted along the red dotted line of (A) are shown. The bracket is labeled B, the enamel E and the gingiva G. The whole system is shown in (C), while (D) shows the handheld scanner. A surface rendering of another tooth with a lesion located on the facial surface is shown in (E); the sound enamel is labeled SE, the lesion L, the cavity in the lesion area Cav, and the gingiva G. A b-scan extracted along the dotted red line is shown in (F); the dentinal enamel junction visible under the sound enamel is labeled DEJ; the lesion is clearly visible with a distinct lesion body and a weakly scattering surface zone, labeled LB and SZ, respectively.
It is difficult to brush between the bracket and the gums, and lesions often develop in the area cervical to the bracket. In other studies, we are monitoring lesions in tooth roots and enamel surfaces during intervention with fluoride to see whether we can detect changes in the lesion structure as a result of remineralization (Figures 5E and 5F).
Meet the author
Dr. Daniel Fried is a professor in the School of Dentistry at the University of California, San Francisco; email: [email protected]. The author would like to acknowledge the support of the NIH/NIDCR as well as the contributions of Cynthia Darling, Michal Staninec, Kenneth Chan, Hobin Kang, Chulsung Le, Shane Douglas and Robert Jones.
References
1. B. Colston et al (1998). Imaging of hard and soft tissue structure in the oral cavity by optical coherence tomography. Appl Opt, Vol. 37, Issue 19, pp. 3582-3585.
2. A. Baumgartner et al (1998). Optical coherence tomography for dental structures. In: Lasers in Dentistry IV; San Jose. SPIE, Vol. 3248, pp. 130-136.
3. F.I. Feldchtein et al (1998). In vivo OCT imaging of hard and soft tissue of the oral cavity. Opt Expr, Vol. 3, Issue 3, pp. 239-251.
4. D. Fried et al (2002). Early detection of dental caries and lesion progression with polarization sensitive optical coherence tomography. J Biomed Opt, Vol. 7, Issue 4, pp. 618-627.
5. B.E. Bouma and G.J. Tearney (2002). Handbook of Optical Coherence Tomography. New York, N.Y.: Marcel Dekker.
6. R.S. Jones et al (2006). Imaging artificial caries on the occlusal surfaces with polarization-sensitive optical coherence tomography. Caries Res, Vol. 40, Issue 2, pp. 81-89.
7. H. Kang et al (2010). Nondestructive assessment of early tooth demineralization using cross-polarization optical coherence tomography. Selected Topics in Quantum Electronics, IEEE J, Vol. 16, Issue 4, pp. 870-876.
8. H. Kang et al (2012). Nondestructive monitoring of the repair of enamel artificial lesions by an acidic remineralization model using polarization-sensitive optical coherence tomography. Dental Mat, Vol. 28, Issue 5, pp. 488-494.
9. R.S. Jones and D. Fried (2006). Remineralization of enamel caries can decrease optical reflectivity. J Dental Res, Vol. 85, Issue 9, pp. 804-808.
10. M. Staninec et al (2011). Nondestructive clinical assessment of occlusal caries lesions using near-IR imaging methods. Lasers in Surgery and Medicine, Vol. 43, Issue 10, pp. 951-959.