Tilman Franke,1 Jose L. Serrano-Velez,2,3 Nydia L. Rivera-Rivera,2,3 Eduardo Rosa-Molinarz,3 and atthias Langhorst1
1FEI Munich (Formerly Till Photonics, 2University of Puerto Rico-Rio Piedras, 3University of Puerto Rico-Medical Sciences
A fixed-wavelength laser in combination with a nondescanned hyperspectral detection system obtains clean images when used with triple-stained samples with all dyes excited simultaneously.
Two-photon microscopy (TPM) is the method of choice for imaging biological samples in vivo, with cellular resolution in three dimensions. Multicolor imaging with several fluorophores – standard in single-photon microscopy – also is desirable in TPM, but existing approaches using multiple lasers are expensive.
Commonly used fluorescent dyes are excited with light ranging from the ultraviolet to the visible part of the light spectrum (UV-VIS). In TPM, the same dyes are excited with IR lasers when the energy of two simultaneously absorbed IR photons is summed up in the excitation process.
A welcome side effect of using IR light (as opposed to UV-VIS) is its superior penetration depth. The degree of scattering scales approximately λ-4.2,1 so at 780 nm, penetration depth is seven times greater than at 488 nm.
The photon flux required for the simultaneous absorption of two photons by a single dye molecule is present only in the femtoliter volume of the focal spot. Therefore, TPM produces fluorescence exclusively in the focal plane of the objective. No rejection of out-of-focus light is necessary to obtain clear images from within the 3-D volume of the sample.
These properties, together with the higher tolerance of cells to IR light, make TPM the method of choice for 3-D imaging with subcellular resolution in thick samples and living animals.2
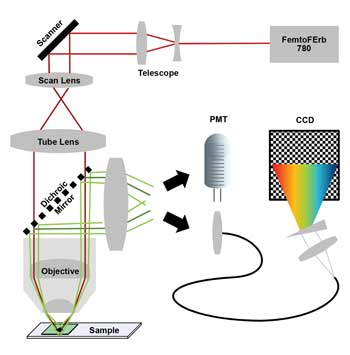
Figure 1. Two-photon laser scanning microscope with 780-nm laser (scanner = galvanometric mirror scanner; PMT = photomultiplying detector; CCD = charge-coupled device of nondescanned hyperspectral detection unit). Images courtesy of FEI.
Another important aspect that we exploit for our simplified multicolor TPM is the fact that two-photon absorption spectra of common dyes are often very broad. As a result, simultaneous excitation of multiple fluorophores by a single IR wavelength in TPM – even if those fluorophores have very distinct absorption spectra under single-photon conditions – is possible with TPM.3 However, splitting the mixed fluorescent dye signal into distinct color channels is challenging for filter-based detection systems. To enable multicolor TPM with fixed-wavelength lasers, we have developed a hyperspectral detection system. Its dynamic range and spectral resolution allow imaging of multilabeled samples, even if fluorophore concentration and brightness are imbalanced and emission spectra are overlapping.
Materials and methods
The simplified multicolor TPM is based on an FEI Intravital2P microscope equipped with a Toptica FemtoFErb 780 fiber laser with 50-mW average power, 100-fs pulses and 100-MHz repetition rate. The laser is passively cooled and small enough to be easily attached to the microscope frame.
The detection system is based on a pair of GaAsP PMT detectors. The 562-nm long-pass beamsplitter slices the spectrum into two color channels: blue/green and red. Scanner and PMTs are optimized for high-efficiency dual-color recordings.
We designed a hyperspectral detection system that can be plugged in in place of one of the PMTs. It splits the spectrum from 400 to 680 nm into 120 channels of 2.34-nm width. The system can acquire a 256 × 256-pixel × 120-channel image in 25 s.
We used Fiji,4 a life-science-oriented distribution of ImageJ,5 to generate sum spectra and pseudo-real-color representations, and the PoissonNMF plug-in6 for blind spectral unmixing.
Results
To help identify a single IR wavelength that would excite as many commonly used fluorescent dyes as possible, we re-viewed excitation and emission characteristics of 24 commonly used fluorescent dyes (Table 1).
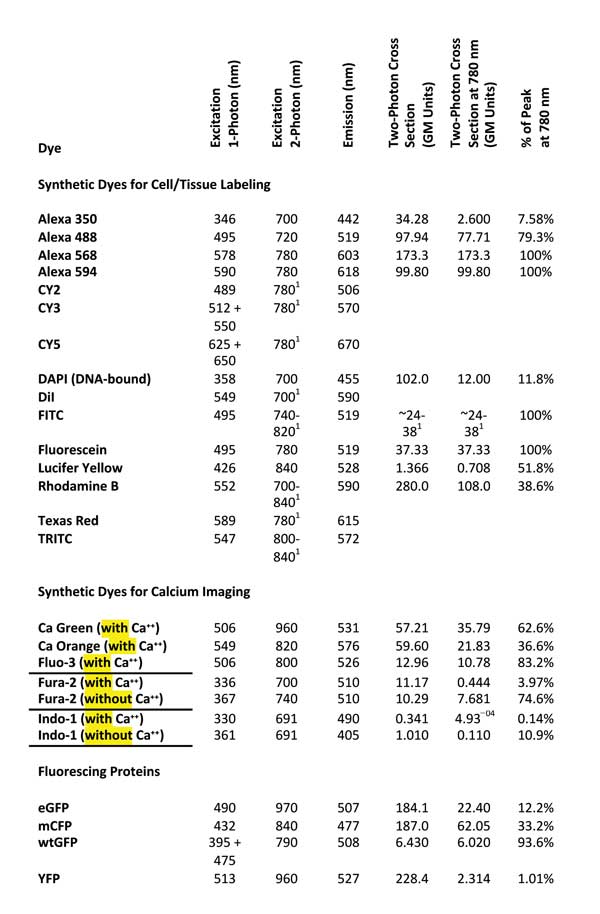
Table 1. Two-photon excitation wavelength and two-photon cross-section data after Reference 8. GM units = Goeppert-Mayer units. Single-photon excitation and emission wavelengths cited from References 9 and 10. Values according to Reference 7.
Although it seems reasonable to expect that the best two-photon excitation wavelength will be twice that of the single-photon excitation peak,7 an examination of experimental data revealed that the excitation peaks for nine of the 24 considered dyes occurred near 780 nm (Figure 2, left). In fact, 16 of the 24 dyes showed sufficient excitation at 780 nm (>50 percent of their peak excitation) to be useful for a 780-nm-only TPM (Table 1, last column).
We concluded that a microscope based on a fixed 780-nm laser should be compatible with the majority of samples commonly used with TPM without the need for special dyes. We tested this claim with a fixed sample and with a fresh, unmixed whole mount of nerve tissue. Both samples were triple-stained.
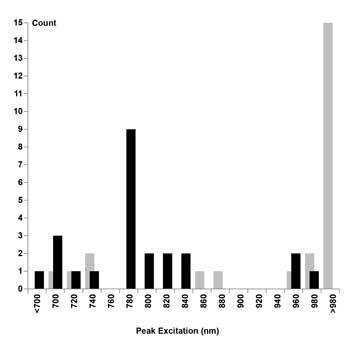
Figure 2. Histogram, quantifying the number of dyes per wavelength in bins of 20-nm width. Optimum excitation wavelengths predicted by rule of thumb plotted as gray bars. Optimum excitation wavelengths found experimentally plotted as black bars.
The first sample was Life Technologies Corp.’s FluoCells slide #4, containing a section of mouse intestine stained with Alexa Fluor 350, Alexa Fluor 568 and Sytox Green nucleic acid stain. The images (Figure 3) show fluorescence from all three dyes upon excitation with the 780-nm laser. The sum spectrum (Figure 3c) shows that Alexa 350 and Sytox Green are weaker than Alexa 568. However, the signal-to-noise ratio in each color channel is sufficient for spectral unmixing (Figure 3b, single-channel spectra in Figure 3d).
The second sample was spinal cord tissue from the western mosquito fish. Retrograde labeling of spinal motor neurons is used to generate 3-D maps of neuronal geometry and phenotype prior to imaging ultrastructure with electron microscopy. Ex vivo spinal cord preparations are up to 250 µm – too thick for single-photon confocal microscopy. Using our simplified TPM, we imaged through entire whole-mount samples with laser power at 20 mW or lower.
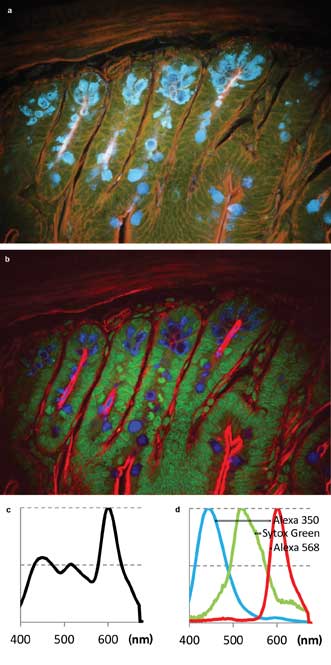
Figure 3. Two-photon multicolor imaging of mouse intestine stained (Life Technologies’ FluoCells slide preparation #4). (a) A pseudo-real color view of hyperspectral image. (b) False-color rendering of the three color channels as detected by blind unmixing.6 Blue: Alexa 350. Green: Sytox Green. Red: Alexa 568. (c) Sum spectrum. (d) Spectra of the three color channels found by blind unmixing.
The sample was stained as follows: Hoechst 33324 (450 to 550 nm), labeled nuclei of all cells; Alexa Fluor 594 Biocytin (618 nm), retrogradely labeled some of the motor neurons; and NeuroTrace 640⁄660 Deep-Red Fluorescent Nissl Stain (660 nm), labeled somata of neurons (only neurons very near the surface were stained). Imaging and spectral results are shown in Figure 4. All three dye signals are clearly distinguished in the final false-color image (Figure 4e).
Discussion
We have shown that a TPM equipped solely with a 780-nm laser is compatible with the majority of fluorophores commonly used in tissue biology and live-animal imaging. The 780-nm lasers often are based on frequency-doubled erbium:glass fiber lasers. They are alignment-free, passively air cooled, intrinsically stable and relatively inexpensive.
All of the dyes used in our samples produced usable signals, including those such as Alexa 350 that were excited to only a fraction of their peak efficiency by the 780-nm laser.
Equipped with FEI’s hyperspectral detector, our fixed-wavelength TPM discerned Alexa 594 and Nissl Deep Red, the emission peaks of which differ by only 42 nm. This ability to separate closely spaced peaks allows combining dyes in a sample that would not be separable in filter-based multichannel detection systems. With the hyperspectral detector, three or more channels can be excited and detected simultaneously, even if emission spectra overlap. We believe the increase in freedom of choosing dyes more than compensates for loss of a few dyes that are not sufficiently excited at 780 nm.
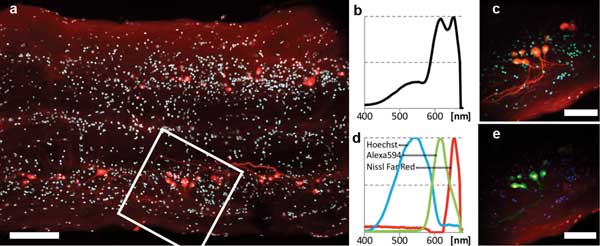
Figure 4. Two-photon multicolor imaging of retrogradely labeled motor neurons in the spinal cord of a mosquito fish (ex vivo). (a) Overview scan ~120 µm deep in the sample. Scale bar = 100 µm. Cyan: Hoechst 33324. Red: Alexa 594 and Nissl Far-Red. (b) 400- to 680-nm sum spectrum obtained in field of view delineated by the white square in (a). (c) Pseudo-real-color view of hyperspectral image obtained in same region. Scale bar = 50 µm. (d) Spectra of the three color channels found by blind unmixing. All spectra are normalized to their own minimum/maximum. (e) False-color rendering of the three color channels as detected by blind unmixing. Blue: Hoechst. Green: Alexa 594. Red: Nissl Deep-Red.
Meet the authors
Dr. Tilman Franke is product manager for multiphoton and spinning-disk instruments at FEI Munich (formerly Till Photonics GmbH); email: [email protected]. Jose L. Serrano-Velez is a Ph.D. candidate at the University of Puerto Rico. Dr. Nydia L. Rivera-Rivera is an assistant professor of biology at the same university. Dr. Eduardo Rosa-Molinar is group leader and an associate professor of anatomy and neurobiology at the university. Dr. Matthias Langhorst is director of product marketing management at FEI Life Sciences.
References
1. M. Oheim et al (2006). Principles of two-photon excitation fluorescence microscopy and other nonlinear imaging approaches. Adv Drug Del Rev, Vol. 58, pp. 788-808.
2. W. Denk et al (1990). Two-photon laser scanning fluorescence microscopy. Sci, Vol. 248, pp. 73-76.
3. K. Heinze et al (2000). Simultaneous two-photon excitation of distinct labels for dual-color fluorescence crosscorrelation analysis. PNAS, Vol. 97, No. 19, pp. 10377-10382.
4. Fiji homepage: http://fiji.sc/Fiji.
5. ImageJ homepage: http://rsbweb.nih.gov/ij
6. R.A. Neher et al (2009). Blind source separation techniques for the decomposition of multiply labeled fluorescence images. Biophys J, Vol. 96, pp. 3791-3800.
7. A. Diaspro et al (2006). Multi-photon excitation microscopy. BioMed Engr OnLine, Vol. 5, Issue 36.
8. Cornell two-photon cross-section data: http://www.drbio.cornell.edu/cross_sections.html
9. http://flowcyt.salk.edu/fluo.html
10. www.lifetechnologies.com