By investigating the molecular structure of protein aggregates called amyloid fibrils, Raman spectroscopy allows researchers and clinicians to probe the cellular genesis of diseases, such as Alzheimer’s, and track their progression.
Madeline Harper and David Punihaole, University of Vermont
There is a need for Raman spectroscopic tools to directly determine heterogeneous mixtures of different fibril polymorphs in the same tissue or even plaques.
The urgent need for rationally designed treatments of Alzheimer’s disease and other amyloidogenic disorders is more relevant than ever; there is a predicted 7% increase of cases of Alzheimer’s by 2025 in people aged 65 and older, according to the Alzheimer’s Association. Several lines of evidence suggest that amyloid-β (Aβ) fibril structure is intimately linked to the pathophysiological features, progression, and clinical subtypes observed in Alzheimer’s disease and its related dementias. Significant progress has been made in understanding the origins of Alzheimer’s due to major technical advancements in structural biology tools. However, gaps remain that need to be filled to obtain a comprehensive picture of Alzheimer’s etiology and to guide treatments. Raman spectroscopy could potentially provide critical links to that information.
Visualizing 3D structures
Raman spectroscopy has evolved as a powerful tool in the biomedical sciences to interrogate the chemical dynamics of biological systems. Recent advancements demonstrate the potential of Raman spectroscopy to visualize the 3D structures of proteins. This capability permits researchers to investigate the molecular structures of protein aggregates associated with amyloidogenic diseases, such as Alzheimer’s, which are difficult to characterize using conventional tools in structural biology, such as x-ray diffraction, solution-state nuclear magnetic resonance (NMR), and fluorescence-based microscopy methods.
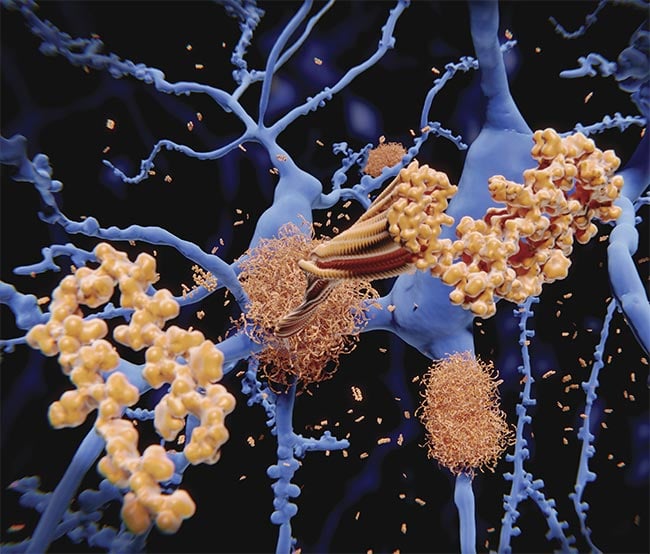
Some of the mystery surrounding the progression of amyloid structure could be answered with Raman spectroscopy. Courtesy of iStock.com/selvanegra.
Despite its historical use (sidebar), Raman spectroscopy has suffered severe limitations in its applications toward characterizing biological systems. The scattering cross sections of vibrations, which dictate the strength of Raman signals, are orders of magnitude smaller than their absorption and fluorescence counterparts. This means that Raman scattering provides an inherently feeble signal, and that Raman measurements require relatively high (millimolar) concentrations and long acquisition times. Furthermore, many biological samples exhibit natural autofluorescence, which results in undesirable background signals that can often distort or completely obscure weaker Raman vibrational signals.
To overcome some of these limitations, important methodological developments have been made over the years. Advancements in Fourier transform (FT)-Raman (that collects wavelength-stable measurements) and near-infrared laser sources made it easier to study biological systems. This was accomplished by exciting within a spectral region that is far less susceptible to fluorescence interference than visible excitation. Similarly, the development of UV resonance Raman spectroscopy also permitted the study of biological systems with reduced fluorescence contamination while also allowing selective enhancement of Raman signals for specific biologically relevant chromophores that absorb in the UV. Finally, the rise of coherent Raman microscopy methods, including stimulated Raman spectroscopy and coherent anti-Stokes Raman spectroscopy, permitted background-free, real-time imaging of biochemical dynamics in living cells.
Quantitative amyloid studies
In recent years, Raman spectroscopy has found niche areas for studying biological systems that were previously difficult to characterize using conventional methods. One system is amyloid fibrils. These filamentous protein aggregates are challenging to structurally characterize using solution NMR and x-ray crystallographic methods because of their insoluble and noncrystalline nature. Their structures can, however, be investigated with molecular-level resolution using solid-state NMR (ssNMR) and cryogenic electron microscopy (cryo-EM).
When Raman spectroscopy is coupled with microscopy, it can be used to characterize amyloid fibrils directly in biological tissues.
Studies using ssNMR and cryo-EM reveal that amyloid fibrils share a common molecular architecture, known as a cross-β structure, where extended β-sheets stack together with their strands aligned perpendicularly to the long axis of the fibril filaments. They also show that fibrils prepared in test tube experiments differ significantly in their molecular structures than those prepared from protein aggregates harvested from the tissues of patients. Another important finding was that amyloids exhibit polymorphism, wherein peptides of the same sequence can form several different types of distinct fibril structures.
While both ssNMR and cryo-EM have revealed a wealth of important insights about amyloid fibrils, they also have their own limitations. For instance, both require large sample loads, expensive isotopic labeling of peptides, many experiments, and long experimental acquisition times that can take several days to complete. To obtain high-resolution structural data, both methods also require extensive sample preparation to ensure that only a single, well-ordered polymorph is present, which can introduce bias toward the most abundant polymorph. In addition, it is difficult to use these methods to study disordered or dynamic regions of fibrils, which could play important roles in aggregation and plaque formation.
In contrast, Raman spectroscopy does not suffer from these drawbacks and often provides complementary molecular-level structural information. Raman has relatively fast data acquisition compared with other techniques. Not only can Raman spectroscopy analyze different sample types, such as solids, solutions, and suspensions, but it can also monitor the aggregation and growth rates of fibril formation. When Raman spectroscopy is coupled with microscopy, it can be used to characterize amyloid fibrils directly in biological tissues.
For fibrils, structurally sensitive Raman vibrational signals come from the amide vibrational modes of the peptide backbone. The amide I (1600 to 1700 cm−1) vibrational mode derives mainly from C=O stretching of peptide bonds. In contrast, the amide II (1470 to 1570 cm−1) and III (1250 to 1350 cm−1) vibrational modes derive from a combination of CN stretching and NH bending motions (increasing and decreasing of the angle between bonds in a molecule). Typically, the amide I vibrational mode has been used to discern protein secondary structure in conventional Raman (and IR) analyses. Polarized Raman intensity measurements of this band can provide additional insight into the orientation of the peptide backbone C=O bonds in fibrils.
Compared to the amide I, the amide III vibration provides more quantitative structural information. Its power and utility lie in the fact that the amide III frequency can be correlated to the Ramachandran Ψ-angle, one of two dihedral angles that dictate the geometry (and hence secondary structure) of the peptide backbone1.
In the ssNMR community, parameters such as distances between atoms and dihedral angles are measured in fibrils and used as structural constraints to guide molecular dynamics simulations to determine detailed 3D structural models of amyloid fibrils. Since Raman spectroscopy also provides quantitative structural information, University of Vermont researcher and professor David Punihaole and his team recognized that an analogous methodology could be employed, wherein Raman-derived parameters could be applied as constraints in molecular dynamics simulations to determine structural models of fibrils.
To test this idea, the molecular structures of three different fibril polymorphs prepared from model peptide systems derived from the amyloidogenic proteins amylin and Aβ were evaluated2. They were able to use the amide I and amide III vibrational modes to measure Ramachandran Ψ dihedral (Figure 1) and C=O bond orientation angle distributions (Figure 2) in the different fibril polymorphs. Researchers then used the widths of these distributions to calculate harmonic force constants that could be applied to constrain the atoms of the fibril structures in molecular dynamics simulations. With these constraints applied, the simulated fibrils were allowed to find their minimum energy structure before longer equilibration simulations could be run.
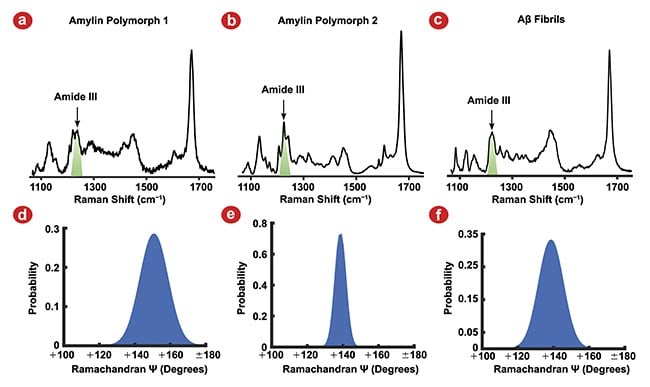
Figure 1. Raman spectra of three amyloid fibril polymorphs, amylin polymorph 1 (a), amylin polymorph 2 (b), and amyloid-β (Aβ) fibrils (c), and their corresponding Ramachandran Ψ-angle distributions. The Amide III vibrational mode used to determine Ramachandran Ψ-angle (green) for each polymorph (a-c). Amylin polymorph 1 Ψ-angle centered at 151°, indicating the β-strands are oriented in an antiparallel β-sheet (d). Amylin polymorph 2 (e) and Aβ fibrils (f) Ramachandran Ψ-angles are centered at 139°, indicating the β-strands are oriented in a parallel β-sheet. Adapted with permission from Reference 2.

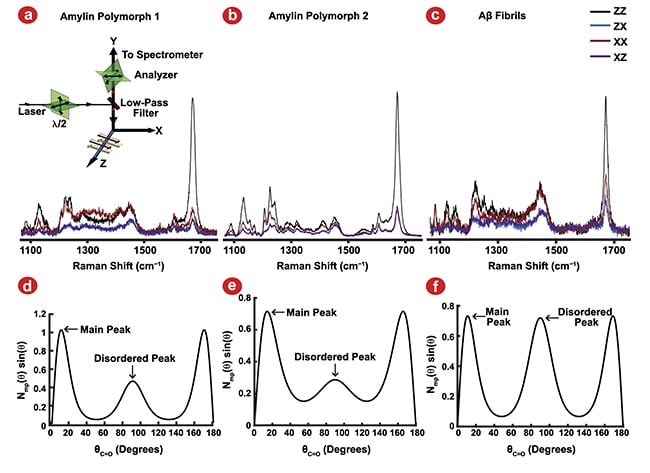
Figure 2. Polarized Raman spectroscopy provides insight into C=O bond angle distributions using the amide I vibrational mode. Polarized Raman spectroscopy configurations (a, inset). Amylin polymorph 1 (a), amylin polymorph 2 (b), and amyloid-β (Aβ) fibrils (c) polarized Raman measurements. The resulting preferred bond orientation of the C=O bonds of the peptide backbone (d-f) for amylin polymorph 1 (d), amylin polymorph 2 (e), and Aβ fibrils (f). Adapted with permission from Reference 2.
As shown in Figure 3, the resulting ensemble of structures obtained from these equilibration simulation runs for the three polymorphs exhibited physically reasonable structural features of fibrils. For amylin, the structural models for the two polymorphs agreed with previously determined structure from ssNMR. This agreement highlights the potential to couple Raman spectroscopy with molecular dynamics simulations to derive a fibril structural model. It also lends credibility to the determination of the novel Aβ polymorph structure proposed in the study.
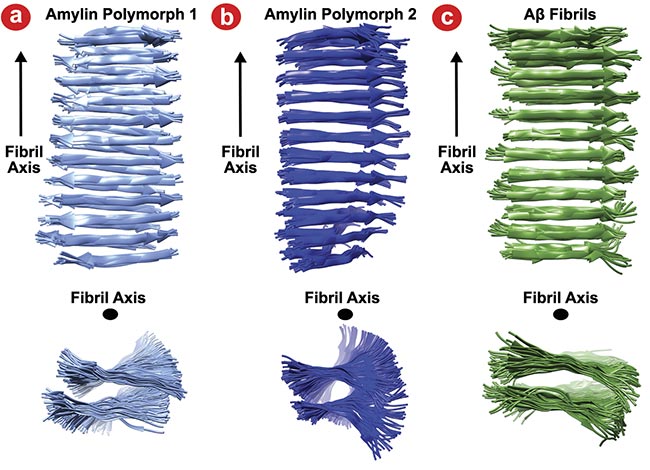
Figure 3. Snapshots of the Raman-derived molecular dynamics structures of amylin polymorph 1 (a), amylin polymorph 2 (b), and amyloid-β (Aβ) fibrils (c). Adapted with permission from Reference 2.
Looking ahead
Recent technological advancements in the field of Raman spectroscopy have ameliorated several previous barriers in probing and studying the structural basis of amyloidogenic diseases. Now, it is possible to obtain quantitative relationships between vibrational modes and structural markers, such as Ramachandran Ψ-angles, and even obtain structural constraints from Raman experiments to feed into molecular dynamics simulations to visualize the 3D structures of model fibril systems.
The spectroscopic methods developed by Madeline Harper and others can be translated to imaging applications to quantitatively evaluate fibril structures in amyloid plaques found in brain tissue. Such applications would provide powerful new insights into how different fibril polymorphs propagate in the brain and how they aberrantly interact with neurons to cause degeneration of tissue. However, there are still gaps that stand in the way of achieving this goal. These include developing methods to structurally characterize disordered and dynamic regions of amyloid fibrils, which could play critical roles in protein aggregation, plaque formation, and plaque clearance.
Moreover, there is a need for Raman spectroscopic tools to directly determine heterogeneous mixtures of different fibril polymorphs in the same tissue or even plaques. Filling these gaps will enable researchers and clinicians to uncover the degrees of severity of various polymorphs, correlate fibril structure to toxic activities, and guide therapeutics and treatment to specifically target, transform, or eliminate specific (toxic) fibril variants.
Looking ahead, to address these challenges above mandates a need to discover spectroscopic markers to determine higher-resolution fibril models derived from Raman measurements. There are markers to measure amino acid side chain interactions, but currently only for glutamine, asparagine, and tryptophan. Another option is to perform isotopic labeling schemes to be able to isolate vibrations specific to amino acids or protein backbone3. This approach lays the foundation to use Raman spectroscopy and molecular dynamics simulations to visualize fibril structures derived from pathophysiologically relevant peptides and proteins. This can also be applied to other biological macromolecular systems, providing an avenue for the growth of Raman spectroscopy to become a more high-resolution characterization method than previously imagined.
Meet the authors
Madeline Harper (Hatch) received her bachelor’s degree in chemistry at Wheaton College, Mass., and is now a graduate student at the University of Vermont under Professor Punihaole. Her research centers around understanding the structural basis of amyloid fibril toxicity via Raman spectroscopy in neurodegenerative diseases; email: [email protected].
David Punihaole received his bachelor’s degree and doctorate from the University of Pittsburgh. He is an assistant professor of chemistry at the University of Vermont and an NIH-funded COBRE Investigator at the Vermont Center for Cardiovascular and Brain Health. His research is focused on developing chemical imaging tools that use Raman spectroscopy to directly visualize the molecular-level structural dynamics and noncovalent interactions of molecules in living cells; email: [email protected].
References
1. A.V. Mikhonin et al. (2006). Peptide secondary structure folding reaction coordinate: correlation between UV Raman amide III frequency, Ψ Ramachandran angle, and hydrogen bonding. J Phys Chem B, Vol. 110, No. 4, pp. 1928-1943.
2. M. Harper et al. (2023). Toward determining amyloid fibril structures using experimental constraints from Raman spectroscopy. J Chem Phys, Vol. 159, No. 22, p. 225101.
3. A.V. Mikhonin et al. (2004). Assignments and conformational dependencies of the amide III peptide backbone UV resonance Raman bands. J Phys Chem B,
Vol. 108, No. 49, pp. 19020-19028.
The Resurgence of Raman
Raman spectroscopy is an inelastic light scattering technique that probes vibrations localized to the chemical bonds of molecules. When laser light illuminates a sample, its electromagnetic field drives the motions of electrons in molecules at the frequency of the incident light and creates an oscillating dipole moment. Because the electrons are being accelerated, energy is radiated from the molecules in the form of scattered light. Most of the radiated light is scattered elastically at the same frequency as the incident electromagnetic field, a process known as Rayleigh scattering.
However, a small fraction of the scattered light oscillates at a frequency that is shifted in energy compared to the incident field. This inelastically scattered light is produced because the motion of the oscillating electrons driven by the incident light couples to slower-moving vibrational motions of atomic nuclei. This creates beat oscillations that vibrate at frequencies that are lower or higher than the frequency of the incident light. This phenomenon is referred to as Raman scattering.
The vibrations probed by Raman spectroscopy oscillate at characteristic frequencies that can be used for the identification of different chemical substituents and functional groups of molecules. These vibrations are also intrinsically sensitive to changes in their local chemical environments and can therefore be used as nanoscale probes to monitor the structural dynamics and interactions of molecules. Raman spectral features directly report, for example, on dihedral bond angles, interaction energies, and local dielectric environments of proteins, nucleic acids, and lipids. Thus, the technique offers a powerful way to quantitatively evaluate the structure and interactions of biological macromolecules.
Historically, Raman spectroscopy has experienced waves of popularity in the chemical and biological sciences. Prior to the end of World War II, it was much easier to perform Raman measurements compared to absorption measurements in the mid-infrared range. After 1945, however, technological advancements in infrared instrumentation decreased the interest in Raman spectroscopy, which resulted in the field becoming specialized among a small community of scientists. During the 1960s and 1970s, the technique experienced a small resurgence due to new technological developments, including the invention of the laser, which permitted easier and faster measurements due to the ability to use monochromatic, highly collimated, and intense light for Raman excitation.
Much of the early work on Raman spectroscopy during the period between 1945 and 1970 centered around establishing how vibrational spectral features report on molecular structure. During this period, the use of the technique for studying biological samples in aqueous solutions was appreciated early on, since water is a relatively weak Raman scatterer. With this advantage, some of the first uses of Raman spectroscopy in the biological sciences were to characterize the structures of biological macromolecules. Pioneering work in the 1960s and early 1970s by Miyazawa, Krimm, and Peticolas, for example, established how the frequencies of Raman bands report on protein and nucleic acid structures. These early studies focused on collagens, silk proteins, and repetitive peptide sequences that provided insights into the molecular architecture of protein secondary structural elements, such as polyproline, α-helices, and β-sheets.