New techniques such as functional MRI are accelerating the understanding of human color vision and giving new impetus to psychophysical studies that help refine mathematical color standards.
Dr. Christine Connolly, Contributing Editor
Color vision has long fascinated scientists, providing topics for research in psychology and physics, as well as in anatomy, physiology and medicine. Substantial information has been gathered over more than 150 years, and with the development of in vivo techniques such as functional MRI, the process continues to accelerate. Researchers already have access to significant, detailed information concerning the construction of the eye and brain, as well as some understanding of how the signals are formed and processed.
In essence, light entering the eye falls upon the retina, which contains three types of cone cells sensitive to short (S), medium (M) and long (L) wavelengths (Figure 1). In the retina and lateral geniculate nucleus, for instance, bipolar center-surround cells offer a link to a collection of rods or cones covering a small area of the retina. An on-response bipolar cell operates so that light shining on the center of the receptive field produces an electrical signal in the bipolar cell, while light shining on the doughnut-shaped surround of the field inhibits the signal. The maximum response occurs with the center illuminated and the surround dark — for example, at an edge or corner in the scene.
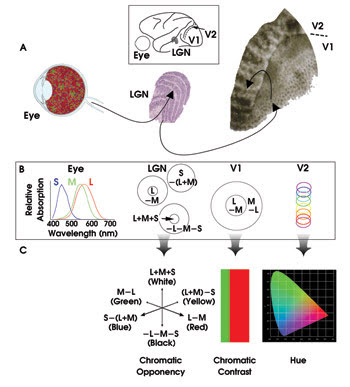
Figure 1. This overview illustrates what is known of the anatomy (A), physiology (B) and perception (C) of color vision. LGN = lateral geniculate nucleus. Courtesy of Bevil Conway, Harvard Medical School. ©2002, Klumer Academic Publishers.
Off-response cells operate the opposite way. Some bipolar cells have a black/white response. Others have a red/green (L2M) or yellow/blue (L+M)2S specialist function. The behavior of these cells explains the perceptual finding that white and black, red and green, and blue and yellow behave as opposites. They act as complementary colors, with a yellow after-image appearing if you stare too long at a blue picture, and so forth. In addition, they form the axes of mathematical color spaces based on color order systems such as Munsell and the Natural Color System.
Deeper in the brain, processing of signals also occurs in the primary visual cortex called V1. “Double opponent” cortical cells compare cone ratios in one part of visual space with those of the adjacent part, enhancing the contrast when a red object appears next to a green one. Recent research indicates that another important area of the cortex, labeled V2, contains thin strips that can detect specific hues.
In fact, visual processing occurs in more than 30 other regions, which can be divided into two pathways, one responsible for object recognition (the What stream) and the other for object location (Where). Both originate at the occipital cortex.
Classical experiments
Two long-established techniques in neuropsychology explore the relationships between brain structure and function. One uses material obtained after death, and the other uses tissues in living creatures. In the second case, the subject is usually a laboratory animal, but occasionally experiments can use humans when the surgery is necessary to treat a medical condition. After staining tissues to highlight particular types of neurons, scientists can use microscopy to study cell structure and connectivity. Electron microscopes can image individual synapses, the site of transmission of electric nerve impulses between two nerve cells.
George Wald and Paul K. Brown first identified the pigments in the human cones at Harvard University in the late 1950s and early 1960s, but it wasn’t until microspectroscopy was perfected in 1964 that it became possible to measure the spectral response of the living eye by shining a narrow beam of monochromatic light on the cells of the retina and measuring the reflected beam. Measurements by John D. Mollon and colleagues in 1983 put the mean peak wavelengths of the cones at 419.0, 530.8 and 558.4 nm. These experiments made use of a Liebman microspectrophotometer to measure characteristics in human eyes that had been removed because of malignant growths.
As a result of many painstaking anatomical studies, researchers know that humans have 100 million rods and 4 million cones per eye, along with 1 million nerve fibers. The cones are within a relatively small central area of the retina, dominating the central 2°, whereas the rods more densely populate the peripheral regions, more than 40° from the visual axis. This accounts for our ability to see stars better by looking out of the corner of the eye. The three types of cone are distributed randomly on the central part of the retina, but they do not occur in equal numbers. The numerical ratio of L:M:S cones is 40:20:1. Because chromatic aberration reduces the focus of the short wavelength light, spatial resolution would not improve with greater numbers of S cones.
Rods, on the other hand, give humans night vision. Although insensitive to color, they are very light-sensitive and active at light levels less than a few hundredths of a candela per square meter.
Following research by scientists in the 1950s on bipolar center-surround cells, David H. Hubel and Torsten Nils Wiesel carried out pioneering work in the 1960s and 1970s on visual processing in the cortex, mainly with cats. They used tiny electrodes to track the electrical discharges through individual nerve fibers and brain cells generated by the retina. This technique monitors the tiny voltages and magnetic fields that active neurons produce and aims to find the place of maximum activity in response to a stimulus.
The technical achievement of this work was considerable. The microelectrodes were so fine that the tip, invisible under the microscope, had to be positioned very accurately while just touching the outer wall of a cortical cell, so as to avoid damaging it. It also was necessary to record the electrical activity with the retina stimulated in a controlled manner and the animal alive and adequately anesthetized.
Hubel and Wiesel, both of whom won the 1981 Nobel Prize in physiology and medicine, discovered that cells are organized in columns at right angles to the surface of the cortex, and that the whole column responds to a line at a particular orientation in the visual field. Besides interactions at the primary visual cortex V1, some cells closer to the V2 area respond to lines in motion and some to moving corners.
An unfortunate by-product of their work was the belief by some researchers that the brain is organized as a hierarchy, with signals first processed in simple ways by cells at the start of the visual path and passed on to more complex cells covering a larger receptive field for more advanced processing. This model encounters a difficulty in that such serial processing would take too long. In 1850, Hermann von Helmholtz discovered that the speed of conduction along a sensory nerve is only 100 m/s. Added to this, each neuron after firing must recover for about 10 ms before firing again. The only way that vision can function at its observed speed is if neurons work in parallel.
In the 1970s, Semir Zeki, using techniques similar to those of Hubel and Wiesel, showed that different visual areas in the brain of the macaque monkey undertake different visual tasks. He showed that area V5 is primarily responsible for motion analysis, and V4 for color. Zeki proposed the theory of functional specialization, which states that different aspects of the visual scene are processed simultaneously in parallel in anatomically separate parts of the visual cortex. This is now the accepted model of visual processing.
In humans, the primary visual cortex V1 is organized into 2000 modules, each with 150,000 neurons and each dealing with the image from a small part of the retina. Each individual module has two thin boxlike regions, one receiving input from the left eye and one from the right. Along the center of each box is a circular core called a “blob,” and in 1988, Margaret Livingstone and Hubel discovered that the cells of the blob are sensitive to color. The lateral geniculate nucleus is a complex six-layer structure in which adjacent points on the retina map to adjacent points on each layer. Furthermore, the layers stack in precise registration relative to each other. The upper four layers feature small cells and are concerned with color vision, whereas the lower two layers have large cells and no color vision.
Since the mid-1970s, scientists have developed several in vivo study techniques. For example, positron emission tomography (PET) scans allow recording the location of brain activity while the subject carries out a particular task. This involves the injection of radioactively labeled glucose because active neurons use more glucose. Regional cerebral blood flow and single-photon-emission computed tomography (CT) are further developments of PET. In the first one, the patient inhales radioactive gas such as xenon, which is then carried around by the blood. Because active neurons need more blood, they are traceable via radioactivity. CT assesses brain structure, but not function, by passing low-level x-rays through the brain at a variety of angles.
Perhaps the most exciting recent development is functional MRI, which maps the brain in slices at different depths by changing the focal depth of the scanner. It measures the response of neurons to radio waves in the presence of a very strong magnetic field. By using the technique in conjunction with stimuli, researchers can relate structure to function. It is sufficiently nonintrusive to allow experimentation not only on living animals, but also on conscious, near-normally functioning beings.
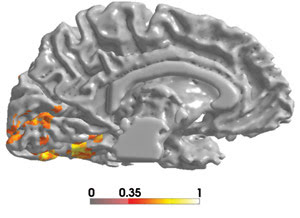
Figure 2a. Using fluorescence magnetic imaging, Alex Wade and colleagues at Stanford University show that the strongest color exchange activations occur in areas V1, V2, hV4 and VO of the human brain. Activations exceeding a coherence level of 0.4 are shown. ©2002, Royal Society of London B.
Alex R. Wade and colleagues at Stanford University in Palo Alto, Calif., working with researchers at Otto von Guericke University in Magdeburg, Germany, are using functional MRI to identify parts of the human brain involved in color vision (Figure 2). They are following up on Zeki’s discovery of color-tuned cells in area V4 of macaque monkeys and searching for which part of the human ventral cortex might serve the same purpose. Zeki suggested human area VO. Wade’s group has found a new visual area close to V3 with a retinotopic map that spans the entire hemifield, which it calls human V4, or hV4. This work has shown that much of the ventral cortex is organized retinotopically (that is, with ordered spatial mapping of the visual field).
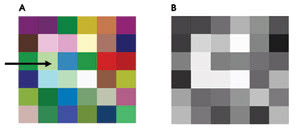
Figure 2b. In the stimulus used in the Stanford University fluorescence MRI experiment, a random drawing of this pattern is shown every 2 seconds. For 12 seconds, the pattern is colored (A), and for another 12 seconds, it is achromatic (B). The observer is asked to identify the orientation of the opening of the “C” (indicated by an arrow, which is not present during the experiment).
Neurological basis
This year, Daniel J. Felleman and colleagues at the University of Texas-Houston Medical School (Nature, Jan. 30, 2003, pp. 535-539) reported their studies of the V2 area of the macaque monkey, which takes information directly from V1 and processes it. Using a very sensitive camera that detects activity-dependent changes in the optical density of tissue, they compared activity stimulated by a black-white grating with that from a red-green grating and showed that the greatest difference occurs in the thin strips of V2. Then they measured the response to gratings of red and gray, orange and gray, and yellow and gray, etc., and found that the peak activity shifted steadily through the array of thin strips.
This exciting finding shows for the first time a possible neurological source of the perception of specific hue — of the psychological result that red and orange are more similar than red and yellow.
Another psychological property of color still not completely understood is color constancy. This is the ability to categorize the color of an object independent of the light source, so that a ripe apple appears red under sunlight or cloudy skies. It is necessary to take into account the color of the light source as well as the color of the object, and this requires the processing of information from a large receptive field. In his work in the 1980s, Zeki explicitly searched for color constancy cells and concluded that this processing occurs in V4. But this year, Thomas Wachtler and colleagues at Universität Freiburg in Germany (Neuron 37, pp. 681-691) have published results showing that cells in area V1 of an awake macaque give a color constancy response.
In a review of recent work on the retinal pathways in primates, Paul R. Martin’s team at the University of Sydney in Australia (Color Research and Application Supplement, 2001, pp. S112-S117) noted that short-wavelength-sensitive (S) cones are present in all diurnal primates studied so far, but that their distribution on the retina varies considerably among species. Using dye injection, the morphology of the connecting cells can be seen under the microscope, while the synaptic contact between the horizontal cells and cones can be measured via intracellular recording. This shows that, despite the differences in cone distribution, the synaptic connectivity (wiring) of S cones is very similar in all the primates studied. They are wired selectively to on-bipolar cells and to retinal ganglion cells producing blue/yellow response.
A recent review of animal color vision by Almut Kelber and colleagues at Lund University in Sweden (Biol. Rev. 78, 2003, pp. 81-118) includes a large list of species on which information has been gathered. The spectral sensitivities of a number of animals have been measured. For invertebrates, such measurement usually involves intracellular recording from photoreceptors in vivo, in response to monochromatic light of known intensity. For vertebrates, suction electrode recording of isolated receptors is more practical. However, some knowledge comes from behavioral tests. For example, researchers may present an animal with two stimuli of different colors but equal brightness, rewarding the animal with food when it successfully discriminates colors.
Overall, recent studies of color vision come from diverse sources, such as biological and neuroscience research, medicine, drug safety monitoring, occupational medicine, ophthalmology (how the eye’s functionality is impaired by diseases, drugs and toxins), genetics (color-blindness patterns in particular human populations), psychophysics, psychology and evolution studies. Color vision is a thoroughly multidisciplinary subject.
Anatomical studies show what the color vision system is made of, and the physiological work provides an understanding of how it functions, in terms of the neurological wiring that processes retinal signals.
Industrial color users such as paint manufacturers, printers and dyers base their quality control systems on the international standards of the Commission Internationale de l’Eclairage (CIE). These standards relate physical measurements, such as the intensity and wavelength of reflected light, to the perceptual output of the human color vision system. They are the product of psychophysical experiments that establish with great mathematical accuracy the input and output of the color vision system, with little concern for the specifics.
The psychophysical experiments are still going on, seeking to refine the mathematical models to yield more accurate results and to describe more complex aspects of color vision. For example, although the CIE 1976 Cielab color difference formula relates the measurement of three broadband regions of the visible spectrum to the perceptual quantities of hue, chroma and lightness, and allows the user to set numerical thresholds for color acceptance decisions, the CIE 2000 formula refines this by building in hue, lightness and chroma weighting functions and an interactive term between chroma and hue differences.
Psychophysical projects
In fact, a number of projects are targeted at integrating the psychophysical and anatomical knowledge. Besides advancing the mathematically accurate description of what the color vision system does, several psychophysical projects aim to comply with the known physiological behavior.
Some researchers have built color vision models based on cone responses and neural processing and tested them against physical color standards. There is still disagreement as to which is the optimum model.
Rolf G. Kuehni of DyStar LP in Charlotte, N.C., recently reviewed some of these models (Color Research and Application, June 2001, pp. 209-222) and noted, for example, “There is mounting evidence that the opponent color system does not operate linearly.” The Cielab color difference formula uses cube roots; other workers have used square roots and logarithms. So far, no nonlinear processes have been found during the biological studies, but this observation from the psychophysics community may act as a catalyst for further work in that area.
The opponent process produces four “unique” hues that are perceived to be pure red, green, blue and yellow. There is a gap between what neurophysiology has described so far and the psychological facts of color vision; namely, the reappearance of red at short wavelengths. Kuehni proposes a solution, asking neurophysiologists to look for additional machinery that subtracts the output of the (2L+M)2S cell from two L2M-producing cells.
Another mismatch he has highlighted is that it seems impossible to place the four unique hues on orthogonal axes without distorting hue difference perceptions. In Cielab, the unique yellow, green and blue fall near the system axes, but red does not. However, he concluded, “Despite some difficulties, our results so far indicate that an opponent-color model with appropriate power modulation, based on cone response functions, produces a three-dimensional geometric arrangement of colors of the Munsell system similar to the psychological one.” He added, “A neurophysiologically supported model for hue perception is missing at this point,” but it may well be that this missing link has now been filled by the work of Felleman’s team.
Other psychophysicists are seeking to learn more about the inner workings of the human color vision system by color categorization studies. In addition, Katsunori Okajima and co-workers affiliated with the Institute for National Measurement Standards, National Research Council, in Ottawa have built a quantitative network model for color categorization. Cross-cultural anthropological studies imply that humans have 11 universal basic perceptual color categories that also appear to be present in monkeys. Biologists have found neurons specific to color categories in the inferior temporal cortex of macaque monkeys.
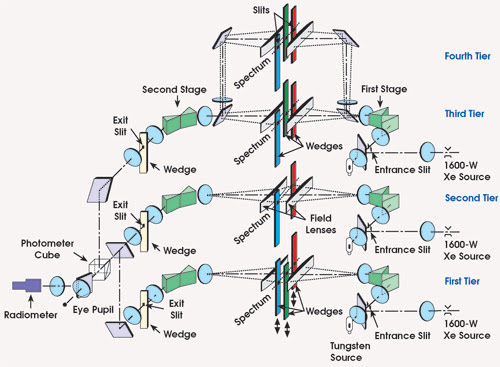
Figure 3. The NRC Stiles Trichromator displays colored lights with different surrounds to study the color categorization behavior of observers. Katsunori Okajima’s study gives insight into the higher-order mechanisms of human color perception.
The researchers used the computer-driven NRC Stiles Trichromator to display 78 test colors, distributed uniformly in CIE x-y chromaticity space (Figure 3). The apparatus uses primary monochromatic lights at 645.2, 526.3 and 444.4 nm and mixes them additively to produce the test colors. The white surround field was produced by a filtered tungsten source. The observers named the colors using one of the 11 terms and also described it on an elemental color scale, estimating whiteness, blackness and chromaticity. The resulting model predicts the categorical naming quite accurately under varied surround conditions. From the physiological point of view, it suggests that a nonlinear color categorization mechanism exists between V1 and the inferior temporal cortex.
Converging paths
In other research, José Antonio Dìaz and his group at Universidad de Granada in Spain (Color Research and Application 26, pp. 223-233) are studying the reaction time to chromatic changes along the red/green and blue/yellow opponent channels of the human color vision system. A microcomputer with calibrated color monitor controls the CIE coordinates and luminance of circular patches of light covering the central 1.5° of the visual field (Figure 4). This experiment allows the researchers to examine the hypothesis that there is one anatomical channel to transmit signals from the S cones and a separate channel for the combined signals from the L and M cones.
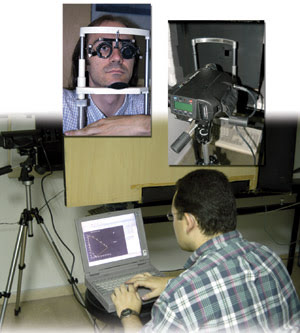
Figure 4. At Universidad de Granada, scientists are studing the reaction time of chromatic changes along the red/green and blue/yellow opponent channels of human color vision systems. Insets show (right) colorimetic calibration of the device, using a spectroradiometer, and (left) a subject in place for the study.
Psychophysical color researchers are seeking to integrate the findings of anatomists and physiologists into their mathematical models. This is stimulating new areas of measurement and new types of experimentation. At the same time, the psychophysicists are highlighting the areas not yet fully explained by neuroscientists and are suggesting specific areas for further study. The two angles on color vision are gradually converging, and the two diverse fields of study are cross-fertilizing each other.
Although it will probably take quite some time before the biological findings have a direct impact on the international standards used by the color industry, researchers continue to work toward the goal of an integrated model of human color vision that accurately describes its behavior and represents its inner workings realistically. Such a model will be scientifically satisfying.