The science of atomic spectroscopy dates back some 140 years. Since that time, a variety of techniques have been developed. In some cases, they compete against each other, but each has a unique history and specific applications and benefits.
Geoff Tyler, Horiba Jobin Yvon SAS
The oldest atomic spectroscopy technique is flame emission spectrophotometry, first employed by Gustav R. Kirchhoff and Robert W. Bunsen in the mid-1800s. Spark emission spectrometry was a natural progression of the method and was developed in the early to mid-1900s for the analysis of conductive solid samples using a spectrographic plate. Lines were identified and intensities determined for each elemental wavelength with the aid of crude measuring devices.
The application of photomultiplier tubes to spark emission spectrometry led to its rapid adoption for quality control in the metals industry. In practice, the only sample preparation required is a rough polish with coarse grinding paper. The sample is positioned in the measurement setup to act as a cathode, and a tungsten anode electrode usually is situated approximately 3 to 5 mm away. When power is applied, the resulting spark erodes the sample, and an array of photomultiplier tubes around a Rowland circle polychromator (Figure 1) or a solid-state detector measures the emitted light at wavelengths specific to elements of interest. This technique is both robust and quick, and it is used extensively on foundry floors as well as in engineering labs.
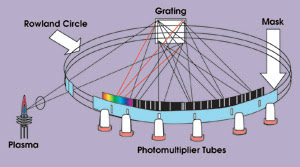
Figure 1. Spark spectrometer optics are shown using the Rowland circle. The technique, both robust and quick, is used extensively in foundries as well as in engineering labs.
Atomic absorption spectrometry was discovered and developed in Australia in the mid-1950s.1 Manufacturers initially used it as an attachment to a flame emission spectrophotometer. However, the technique has its own unique advantages in that it requires only a simple low-cost monochromator, reducing cost as a result of the lack of spectral interferences.
Another attraction is relatively simple sample preparation. Although the technique requires a sample solution, it enables the examination of virtually any sample with simple calibration standards, and thus it quickly replaced other “wet analysis” methodologies such as titration and gravimetry, as well as polarography, which had been emerging in the 1960s for element determination.
Later technical advances led to electrothermal vaporization atomic absorption spectrometry using a carbon rod or tube, which was developed to reduce detection limits to parts-per-trillion levels for some elements and to offer a limited microsolid analysis capability.
Inductively coupled plasma optical emission spectroscopy, although invented and patented in the UK in the early 1960s,2 was developed mainly in the US. It became available in the mid-1970s after abortive commercial efforts late in the previous decade. The technique offered the ability to detect more elements — for example, phosphorus, sulfur, iodine, bromine and chlorine — and detection limits in the parts-per-billion range with fewer matrix interferences. The triple advantages of better detection limits, more elements and multielement analysis made it faster than any alternative at the time.
However, inductively coupled plasma optical emission spectroscopy required the use of a high-resolution spectrometer because of the rich spectra obtained from the plasma, and this meant a higher specification and price. As time progressed, it was realized that with a higher resolution, approaching the natural linewidth of approximately 3 pm, one could eliminate many spectral interferences, even in potable water samples, and therefore could improve the detection limits by reducing the background noise (Figure 2).
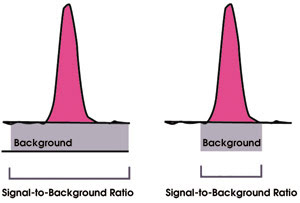
Figure 2. Improvements in the signal-to-background ratio and detection limits in inductively coupled plasma optical emission spectroscopy result in higher resolution.
Initially, many who were interested in this type of spectroscopy for environmental analysis did not foresee the effect its improved productivity would have on demand for its use. Once this was realized, big multifunctional environmental labs were created from many smaller labs that had employed atomic absorption spectrometry. This trend started in the mid-1980s with water authorities in the UK and in contract labs in the US. Unit costs for analysis tumbled; for example, a water authority in the UK replaced 155 labs with just one superlab that performed more analyses than before with far fewer chemists.
In the 1970s, work on glow discharge optical emission spectroscopy resulted in the creation of a small, enclosed, low-temperature plasma at a reduced pressure, in which the sample became the cathode. Although it offers multielement concentration (bulk) analysis, the main benefit of this technique is its constant and dynamic analysis capability as the plasma erodes through a solid sample, known as depth profiling. Glow discharge optical emission spectroscopy enables surface and depth profiling at one-tenth the cost and at 1/200 the analysis time of other depth-profiling techniques such as secondary ion mass spectrometry.
A related method, radio-frequency glow discharge optical emission spectroscopy, can analyze nonconducting materials and can start from a surface layer depth of only 1 nm up to about 250 μm or more. With these advantages and new features that enable analysis of thin glass and other low-melting-point materials, it is expanding its market appeal. However, because it is a surface analysis tool, glow discharge optical emission spectroscopy doesn’t really compete or overlap with the other techniques mentioned.
Finally, in the early 1980s, an interface was developed in the UK to fit a mass spectrometer to the inductively coupled plasma,3 which led to the rise of inductively coupled plasma mass spectroscopy. This reduced detection limits for the elements analyzed by this method to the parts-per-trillion range and resulted in less spectral interference.
Applications and markets
Spark emission has a steady market that is concerned with replacing existing instruments in the metal production, foundry and engineering labs for quality control applications. Flame atomic absorption spectrometry has lost market share since the mid-1980s, but it retains much appeal because of its low investment and running costs for the rapid analysis of samples for just a few elements.
Electrothermal vaporization atomic absorption spectrometry still is in favor for targeted applications such as the detection of lead in blood, but multielement studies increasingly are being performed using inductively coupled plasma optical emission and inductively coupled plasma mass spectroscopy. The environmental analysis sector is by far the largest market for both spectroscopy methods, but many labs in recent years have switched from the former to the latter because of its superior detection limits.
Although atomic absorption spectrometry, inductively coupled plasma optical emission spectroscopy and inductively coupled plasma mass spectroscopy compete for similar markets, they tend to seek the same business only in the environmental field.4
Elsewhere, the superior detection limits of inductively coupled plasma mass spectroscopy restrict its use for the measurement of samples with concentrations in the level of high parts per million to percentages. In this range, inductively coupled plasma optical emission spectroscopy is better and more flexible.
The emergence of major markets such as the Far East and Russia is helping to maintain or increase sales for most techniques, despite the decline of atomic absorption spectrometry in the US and Europe with the consolidation of their laboratories.
In the past 40 years, atomic spectroscopy has progressed beyond expectations for virtually all the aforementioned variants. The methods continue to thrive, although their roles are shifting with the expansion of alternative systems. Yet each will have a sizable market for at least another 40 years because no one technique will replace all the others.
Meet the author
Geoff Tyler is worldwide inductively coupled plasma product manager for Horiba Jobin Yvon SAS in Longjumeau, France; e-mail: [email protected].
References
1. A. Walsh (1955). The application of atomic absorption spectra to chemical analysis. SPECTROCHIM ACTA, Vol. 7, pp. 108-117.
2. S. Greenfield et al (1964). High pressure plasmas as spectroscopic emission sources. ANALYST, Vol. 89, pp. 713-720.
3. A.R. Date and A.L. Gray (1981). Plasma source mass spectroscopy using inductively coupled plasma and a high resolution quadrupole mass filter. ANALYST, Vol. 106, pp. 1255-1267.
4. G. Tyler. ICP-OES, ICP-MS & AAS techniques compared. JY Technical Note 05.