Standards are needed to establish the future of solid-state lighting.
Bill Kennedy and Eric Bretschneider, Toyoda Gosei
The LED industry and its organizations seem to be approaching the problem of establishing an infrastructure for the technology from the wrong end. We are examining specific “problems” with the assumption that solid-state lighting is mature and needs only final guidelines. We are really racing forward into greater complexities without resolving basic problems.
Many governments sponsor an increasing number of projects with which businesses and universities are getting involved. Although many disparate groups are voluntarily working to establish standards, some are duplicating efforts. LED companies are producing a myriad of products using various methods, definitions and processes without any real commonality. How can we realize consensus in the milieu of the LED industry’s lack of meaningful standards and its piecemeal rush to a welcoming market?
About 6 percent of the LED market is relegated to solid-state lighting, while 60 percent is for portable electronic appliances. To truly change will require definitions and standardization. Through standardization, the industry can more easily address the issues of increased performance and economies of scale, which will make solid-state lighting use more widespread. Only through mass production of identified standard products that are designed, produced and delivered to established and accepted criteria will the true potential of solid-state lighting be realized.
The basic structural items that must be addressed via industry — perhaps aided and abetted by government — should be comprehensive and should encompass all sections of this industry, including LED die and package manufacturers; modular and subsystem manufacturers; luminaire and lighting system companies; drive, address and control components; power conversion and alternate low-voltage source providers; testing and qualification; and designers and research organizations.
Package standardization
The many nonstandard formats that LED manufacturers use are obstacles to the standardization effort. Standardization of incandescent and fluorescent sources is a primary reason for their low cost, but the LED industry is relying on standards set for other types of electronics, such as those set by the Joint Electronic Device Engineering Council. It sorely needs its own.
Design and package formats as well as materials and performance criteria are needed. Footprint, materials and thermal performance are among the aspects that should be examined. At least 100-mW, 0.5-W and 1-W packages could be studied, although we may find that these values don’t make sense, given current trends in industry. For example, the current density of 0.5-W die is higher than that of 1-W die, which is already two times that of standard devices.
Because LED efficiency decreases with rising current density, we are effectively sacrificing efficiency in the name of raw output. The industry touts the efficiency of LEDs and then shoots itself in the foot by seeking more lumens per package instead of more lumens per watt. Multichip and monolithic approaches to packages should be defined so as to offer the industry a common path.
LED components can benefit from standardization of issues surrounding heat. Depending on the operational environment, users should be offered a selection of standardized heat sinks. Should LED components add heat sinks, or should luminaire makers “design in” concessions for their insertion and attachment to take advantage of the base luminaire materials? This change cannot take place without industry leadership. With minimal effort, a more economical approach can be found.
As long as voltage converters that allow LEDs to be operated directly from 110 V aren’t built in, voltage conversion is mandatory. Additionally, at the system level, it may end up being the most expensive component in the bill of materials, even exceeding the cost of LEDs. If industry could establish standards for how LEDs should be driven, including series/parallel configurations, it would eliminate a lot of guesswork for companies that want to use LEDs.
Now, a company typically starts from scratch or tries to get information from an LED supplier. Even if suppliers all gave the same advice, everyone would likely hear a different message because of individual biases and concerns. Such standards should focus on transformer configurations and technology and on how to drive and control the end device. Once standardized formats and methods are defined, cost can be reduced, as it was for fluorescent ballasts. Hand in hand with these standards should be low-voltage definitions that are suitable for this type of installation as well as alternative off-the-grid power supplies.
Luminance/optical power
The optical power of LEDs is typically reported in milliwatts, but even within the industry, some companies report it in watts. It is important to realize that this specification is a measure of the optical output of a given LED and not related to the electrical power that it consumes. This is in contrast to incandescent lights, which are rated in watts — a direct measure of the electrical power consumed by the lightbulb. Consumers who are used to incandescent lights believe that a higher power rating means a brighter light. However, the true measure of the amount of light is the lumen.
Correcting the perception that more watts equals more light will not be a trivial task. Even after being on the market for years, compact fluorescent bulbs are rated in the equivalent to incandescent wattage, which is not an accurate estimate of light output. If the compact fluorescent industry couldn’t change the mind set, can the solid-state lighting producers?
Even inside the industry, manufacturers mix radiometric units (what equipment reads) and photometric units (what the human eye sees). LED die are often sold in bins that are divided by dominant wavelength (photometric) and milliwatt power levels (radiometric). Even when only photometric units are used, die are sold based on millicandela. These units describe intensity of light, or how much light falls inside a specified angle. Without detailed information on the measurement conditions (viewing angle, distance, detector area), this information allows only a rough comparison at best. Die customers still must perform benchmark comparisons for each supplier because the information in specifications is not enough by itself to make an accurate comparison. What is needed is a set of standards on how to measure both die and packages. These should cover equipment, measurement conditions and how to report values.
Once measurement equipment and conditions are standardized, the industry must look at how intensity or brightness rankings are set. Across the industry, intensity ranks range from less than 10 percent to more than 40 percent. The true irony of this disparity is that some companies with the widest intensity variations now offer “half bins” that are still twice the size of other companies’ standard bins.
LED ranks and bins
What guidelines exist for setting a baseline? According to Weber’s “law of just noticeable differences,” intensity variations of 10 percent or less are not generally noticeable to the human eye. With this as a benchmark, users should not have to sort LEDs with an intensity rank on the order of 10 percent or less. This is a realistic goal that can and has been achieved with the mass production of packages such as Toyoda Gosei’s E1S62-YW series side-view LEDs (Figure 1). These are low-profile surface-mount LEDs with intensity ranks of 8.9 to 10 percent. In the future, more and more products must be sorted to this type of tight criteria to encourage adoption of solid-state lighting technology.
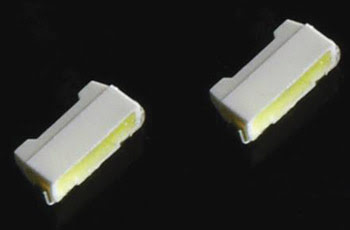
Figure 1. These plastic leaded chip carrier LEDs offer intensities of 2000 mcd (>60 lm/W) and are available in chromaticity bins on a par with a four-step MacAdam ellipse and intensity ranks of 10 percent or less.
Even if the issue of how to determine and measure the luminance or flux from LEDs is resolved, the minefield of how LEDs are sorted and binned remains as a significant barrier to adoption of solid-state lighting. Assuming that all the issues of standardized packaging and of measurement conditions and equipment have been resolved, manufacturers are still left with the choice of how to sort their product, and many do it differently.
This problem has many facets, but let’s begin with chromaticity bins. Manufacturers have a choice in how to represent the chromaticity (color) of LEDs. For monochromatic LEDs, most are in agreement that the vast majority of the devices are sold by dominant wavelength. Although this apparent uniformity is noteworthy, the statement does have a few caveats.
To begin properly discussing chromaticity, it’s important to establish the framework and options. The standard chromaticity diagram used in the LED industry is the CIE 1931 2° Standard Observer, which was set by the Commission Internationale de l’Eclairage (CIE) in 1931 and based on data from and studies conducted in the 1920s (Figure 2). Despite many well-documented deficiencies, this is the de facto choice for chromaticity measurements in the LED industry. This diagram allows users to define chromaticities using two indices, CIE x and CIE y. An alternative method is to use dominant wavelength and excitation purity.
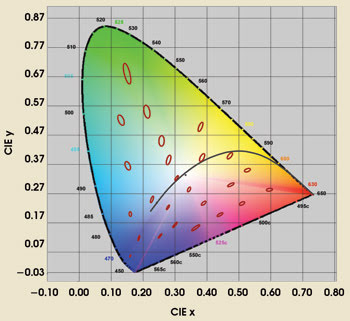
Figure 2. On this standard CIE chromaticity chart for the 1931 2° Standard Observer, red ovals indicate location and size of four-step MacAdam ellipses. The gray line is the Planckian locus of nominal white chromaticity.
These methods have different strengths and weaknesses. It’s important to point out that both systems are, in fact, interchangeable and are fully equivalent. The key difference is their best use. As stated above, the dominant wavelength/excitation purity metric is most commonly used for monochromatic LEDs. Unfortunately, only a portion of this information (dominant wavelength) is used. Without the companion metric of excitation purity, dominant wavelength remains a useful but not always fully adequate specification.
Delving further into the nature of human color vision, many studies have been conducted to determine the minimal perceptible color differences. This phenomenon has been studied from many aspects, including dominant wavelength, excitation purity and chromaticity coordinates. For monochromatic LEDs, binning by dominant wavelength and excitation purity is really the only viable option. For nonsaturated (white) LEDs, dominant wavelength has little meaning because of the method by which it is defined: extending a line from the equal energy point (0.3333, 0.3333) of the chromaticity diagram through the coordinates (CIE x, CIE y) of the illuminant until it intersects the spectral locus (boundary of the chromaticity diagram).
Thus, the dominant wavelength of any light source whose chromaticity coordinates lie near the equal energy point can be changed very quickly by minor changes in the spectral output. Put another way, white isn’t really color; it is, in fact, achromatic. Therefore, we should not try to define it in terms of colors. For these LEDs, the best approach to binning is to use chromaticity coordinates based on MacAdam ellipses (Figure 3). The question is how to best use them in a standard way.
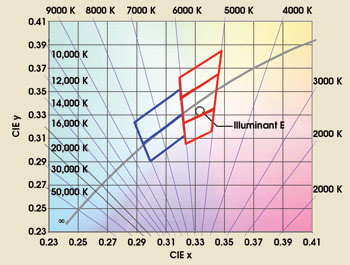
Figure 3. Alternatives for white LED binning are shown on this chromaticity diagram. The blue pins show a pairing scheme with one bin above and one bin below the Planckian locus. The red bins include a “preferred” bin that straddles the Planckian locus.
The MacAdam ellipse was developed in 1943 for mathematically constructing ellipses around target points. The steps, such as 1, 2, 3, 4 and so on, are standard deviations. The American National Standards Institute has adopted the four-step ellipse as the recommended standard for fluorescent and incandescent lamp manufacturers, which gives them a fairly wide range of perceivable differences. Theoretically, sticking with a four-step ellipse would mean that all lighting that meets that standard would look the same, but by its very definition, it is four standard deviations from the target, which are just noticeable to the human eye. Although some observers have expressed concerns as to whether the industry will ever be able to achieve this level of control, the reality is that the specifications allow for only a slightly noticeable difference in chromaticity.
Once we decide on the ellipse size to use — for example, if it’s a step 1, 2, 3, 4 or more — we can begin to stake out territories. Then we need to decide if we want a series of “bins” that straddle the Planckian locus. Many would be against this because they doubt that manufacturing technology would allow production to track the locus closely enough. “Spillover” above and below this preferred bin inevitably would lead to a minimum of three bins. If we target pairs of bins — one above and one below the Planckian locus — the consensus is that we might have a chance. Otherwise, we could expand to four bins with two designated as preferred.
Color quality
Color quality for incandescent/fluorescent lighting is determined by the color rendering index, but this criterion is not as well suited to LEDs, and those who are involved in traditional lighting technologies do not want to change it. Hence, the color quality index is being promoted for LEDs. Many say it will take at least five years before we have a color quality standard, but work is ongoing. Many engineers are concerned about eliminating negative rendering values because they can severely distort the final (average) value, thus penalizing the manufacturer for rendering a more saturated sample.
The current color-rendering index metric is based on the average of eight indices that represent moderately saturated colors. Other indices are based on highly saturated colors as well as nominal skin tones. Those associated with Caucasian and Japanese skin tones are highly unsaturated but have dominant wavelengths very close to the specification for amber traffic signals. A skin tone matching this specification may be considered normal for a jaundiced individual, but it is hardly a way that healthy individuals would choose to appear.
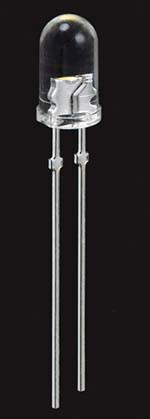
Figure 4. This standard T 1 3/4 5-mm lamp has a typical brightness of 15,000 mcd.
The straightforward approach of averaging individual indices as done in the past is also bothersome. Numerous studies have shown that the preferences for a light source often have little to do with the color rendering indices. At a minimum, we could look at data from past studies and correlate human preferences with all 15 of the individual rendering values. Once this is done, we could then derive a weighting scheme for each rendering value that would more accurately reflect how it is perceived. If not enough data are available, new studies could be initiated. In a year, a single university could easily survey hundreds of subjects. This is undoubtedly the best approach for a new color quality index.
With these components, we would have all the parts needed to implement a new specification or designation of the color quality index that would have three parts:
1. Color temperature metric: Using some type of alphabetic designation would help educate consumers about correlated color temperature. The problem is that the general public probably will assume that smaller intervals are better, and this simply isn’t the case.
2. Distance from the Planckian locus: If we assume a set of four bins that straddle the locus, we have a pair of preferred bins that are adjacent and another pair of bins that are “off white.”
3. Quality index: This would be a representation of the new index bases, which are human preferences for how a source renders, with weighting based on the studies outlined above.
The simple rating system that is used in the tire industry may be a great model to emulate. It has ratings for speed, traction and wear. The color quality index metric would have two ratings for shade of white and one for the rendering properties. We could even add a rating based on reliability. Instead of a blanket target of, say, 50,000 hours, why not allow for ratings of “lower” reliability? Tires have ratings that span 20,000 to >70,000 miles. Shouldn’t we consider the same for solid-state lighting? This could be as simple as a benchmark based on lifetime (to 70 percent intensity/10,000 hours) and then round off. The end user could look at lifetime scores/indices that range from 20 to 50+.
One other major modification to rendering calculations is required, and indeed the consensus appears to be that all calculations be converted to analytical forms. Too many of the spectra involved in calculations are based on data tables, which forces users to make some assumptions about how to average spectral data to match the tables. If all the spectra are converted from tabular to analytical format, arbitrary spectra can be analyzed on an even basis. Depending on the wavelength interval of the spectra, slightly different values would be obtained. This would not have any significant effect on LED spectra but may very well make a significant difference for fluorescence spectra, because many of the emission lines are very narrow.
Efficiency and efficacy
It’s important to look at the overall efficacy of the luminaire, which includes the wall-plug performance or energy used compared with the lighting provided. A simple standard, somewhat like the Energy Star rating, could use a higher number to indicate a greater lumens-per-watt performance level. We could break out performance beginning at 30 lm/W and every 10 lm/W from there. If we take advantage of rounding, we can have a simplified scheme that would make sense to end users. For example, it could include:
• Correlated color temperature.
• Distance from Planckian locus.
• Color quality.
• Efficacy.
The only major developmental effort required for specifying these codes is the spectral preference study. Again, we are not suggesting that we reinvent the wheel. The existing framework is more than adequate. We only need to fine-tune the process and use it. Major changes would be as follows: Readjust rendering values to eliminate negative values, and change weighting factors so that important “colors” are given higher ratings.
Time, leadership and cost
Unfortunately, there is a lack of understanding, practice, definition, standards, techniques and processes within the LED industry. Meaningful progress is limited, not through lack of trying, but through lack of a consolidated process. The fragmentation and duplication of effort are encouraging even more fragmentation and duplicated milieu. The opportunity of solid-state lighting seems, for many, to have morphed into a new way to gain industry and government sponsorship, to create larger budgets and to ensure jobs. All the while, purchasers of LEDs deal with a product that will not work for them or isn’t “as advertised.”
Volunteer societal organizations are trying to develop approaches to standards, but many people with knowledge of the industry cannot afford the time to volunteer or the cost of membership. Governments around the globe are sponsoring technology initiatives, yet some are taking seemingly limited interest in establishing the foundations needed to allow the solid-state lighting industry to focus and drive down costs. Educational organizations are developing products and technologies that appear to compete with industry. LED semiconductor and component packaging companies are wondering what they should make. Producers test products one way, integrators another, and systems designers use different criteria. There is no consensus even on how a blue LED should be specified or tested, let alone a white LED. This is after many years of work, and once defined and submitted to the CIE, will take many more years to complete.
The US government initiated its solid-state lighting program in 2000. The many accomplishments achieved include several technology advancements as well as a variety of supportive funding and policy initiatives. However, in the humdrum world of infrastructure — for which the US has always been looked to to lead the way, and which is sorely needed to bring solid-state lighting into general lighting — little, if anything has been achieved.
Building a US Department of Energy-sponsored Technologies Program without a structural program is only part of the equation. In other words, we will gain much from technical advancement of solid-state lighting, but we may not be able to realize the technology’s potential quickly and affordably, without the prerequisite structural systems in place to define it and use it easily and economically.
The tasks are many, and much work is required. Industry and government are becoming more aware of the lack of infrastructure and definition as it relates to solid-state lighting. More people, companies and agencies are getting involved. Work is moving forward, albeit too slowly. There is much we can do to lead these efforts, move them along more efficiently, support them financially, finalize and implement them without duplication of effort and in a compressed time frame.
Meet the authors
Eric Bretschneider is assistant sales manager of Toyoda Gosei Co. of Troy, Mich.; e-mail: [email protected].
Bill Kennedy is general manager of the Optoelectronics Div. of Toyoda Gosei; e-mail: [email protected].