Optical sensors have many advantages, but before they can compete effectively in the $50 billion global sensor market, their prices have to drop.
Peter Kiesel, Oliver Schmidt and Noble Johnson, Palo Alto Research Center (PARC) Inc.
Many new applications of optical sensors have emerged in recent years. The automotive sector is creating demands for robust and advanced optical sensing as optical information processing expands into the next generation of automobiles. Optical sensors are widely used in monitoring the condition of civil structures, as well as in biological, chemical and environmental applications.
In comparison with their electronic counterparts, optical sensors offer many distinct advantages. They are sensitive, allow for remote and distributed sensing, can be used in harsh environments and are immune to electromagnetic interference.
Optical sensors still constitute only a small part of the $50 billion market for sensors, although their share is continuously growing. The biggest factor inhibiting their use is their comparatively high cost. Recently there have been many reports of inexpensive fabrication methods; nonetheless, the lack of low-cost interrogation systems remains a major limitation to their widespread deployment.
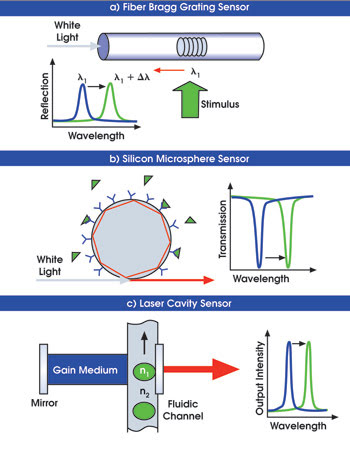
Figure 1. Exemplary optical sensors selectively reflect (a), transmit (b) or emit monochromatic light (c). An external stimulus changes the wavelength of thelight. A high-resolution wavelength detector is required to detect the typically small wavelength changes.
The functionality of many optical sensors (Figure 1) relies on a change in the spectral wavelength response upon an external stimulus (e.g., temperature, strain, stress, acceleration, biocoating or chemical environment). In fiber Bragg grating sensors, for example, the reflection spectrum changes in response to an appropriate external stimulus.1 Similarly, changes in the reflected spectra of two- and three-dimensional photonic crystals can be used for optical sensing applications.
In recent years, several biosensing applications have emerged that are based on a spectral shift of the transmission and reflection properties of a surface or object. Surface plasmon resonance sensors are being used for screening biochemical interactions, and research groups have developed other optical biosensors based on Fabry-Perot cavities in porous silicon or guided-mode resonance reflectance filters. Another application uses the shift of optical resonances (whispering-gallery modes) excited in silicon spheres to quantify DNA.
All these sensors require an external light source that illuminates the sensor element and a detector that monitors the sensor’s spectral response. In contrast, active devices generate light within the sensor, with the wavelength of the generated light dependent on external conditions. For example, the cavity of a laser structure can be changed by pressure or absorption. Systems have been demonstrated that indicate a change in refractive index within a laser cavity by a shift of the output wavelength. Similarly, specific binding of biomolecules at the periphery of a microdisk laser can shift the output wavelength.
The challenge for all these concepts is that the induced wavelength shift is usually small. Precise wavelength detection with subpicometer spectral resolution is key to achieving high sensitivity. At the same time, it is desirable to have this capability over a large spectral range to achieve a high dynamic range. Additionally, high-speed detection allows monitoring of the fast dynamics of a process. No existing technology provides all these features in a reasonably sized and priced device.
However, a low-cost and compact wavelength-shift detector has been developed that is suitable for any of the sensors described above. Its key features include compactness (chip size), lack of moving components, customized spectral resolution, fast read-out and monolithic integration.
Competing concepts
Several methods currently are used to detect small spectral changes of optical sensors.2 In one, the interrogation system is a spectrum analyzer that can be based on a conventional grating or prism, or on an interferometer. Grating-based spectrometers generally provide spectral resolution of only 0.1 nm and, therefore, require sophisticated data processing techniques or differential readout concepts to detect small spectral changes in the monitored signal. Mach-Zehnder and Fizeau-type interferometers usually provide exceptional wavelength information but are bulky, expensive and vibration-sensitive. Fiber-based interferometers do not suffer from these limitations, but their spectral range is limited.
Much cheaper, passive approaches rely on the wavelength-dependent transmission of simple spectral filters. For example, several photodiodes can be covered with different bandpass filters that allow only a small spectral band to penetrate the detectors. Then, the signal from each detector is proportional to the spectral intensity at the filter’s wavelength. Or, in a variation on this theme, two photodiodes with different bandgaps can be stacked on top of each other. The spectral responses of two diodes are different because of the difference in bandgap. Usually, these inexpensive concepts enable very compact and rigid wavelength detectors; however, they are limited to a narrow spectral range and suffer from poor spectral resolution.
And, finally, rather than illuminating the sensor with a broadband source and monitoring the wavelength of the reflected signal, an alternative approach is to illuminate the sensor with a narrowband wavelength-tunable laser and to monitor the amplitude of the reflection. Although this approach often is technically attractive, the cost and complexity of the tunable laser are significant drawbacks.
We have developed prototypes of low-cost and compact wavelength detectors suitable for the readout of all kinds of optical sensors that are based on a wavelength shift. The combination of a coating with laterally varying transmission properties and a position-sensitive photodetector can resolve wavelength shifts down to about 0.1 pm. The coating converts the wavelength information of the incident light into a spatial intensity distribution that can be detected with high precision with a position-sensitive detector.
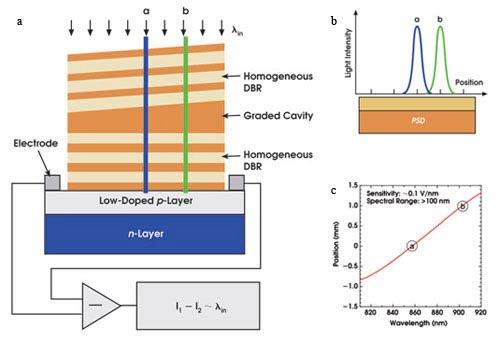
Figure 2. A filter with laterally varying transmission properties transforms spectral information into spatial information (a). A photodetector records the intensity distribution behind the filter. The filter transmits different wavelengths at different positions, as shown for two illuminating wavelengths (b). The system’s electrical signal varied linearly with wavelength (c). DBR — distributed Bragg reflector; PSD — position-sensitive detector.
Figure 2a is a sketch of an example of the device in which the laterally varying transmission is provided by two distributed Bragg reflectors separated by a wedge-shaped spacer. Light at different wavelengths is transmitted at various locations along this Fabry-Perot-like structure (Figure 2b). Underneath this structure, a position-sensitive detector monitors the light intensity transmitted as a function of position.
This detector can be a large-area photodiode with a highly resistive top layer and a common back contact. There are two electrodes on opposite sides of the top layer. The resistivity of the top layer is uniform; therefore, the photogenerated current at each electrode is inversely proportional to the distance between the incident light spot and the electrodes. The photocurrent through both top contacts will vary with a change in the position of the light beam on the detector surface. The difference in the two photocurrents gives a precise measure of the position of the light spot. Normalizing by the sum of the currents eliminates the dependency of the position measurement on the intensity of the incoming light:
I1 – I2
Idiff = ————
I1 + I2
Consequently, the resultant value is independent of the incident light distribution and varies linearly with the position of the light spot. Similarly, a photodiode array can be used to detect the position of the light spot.3
Demonstration of concept
To demonstrate the feasibility of this approach, we filtered the output of a halogen lamp with a grating-based monochromator, producing light with a full width half maximum of 1 nm. We collimated this light and directed it at a prototype chip assembled from a 5-mm-long large-area photodiode and a wedged Fabry-Perot structure of the same length. From one end to the other, the wedged Fabry-Perot transmitted from 800 to 950 nm, so that the chip had a spectral gradient of 30 nm/mm.
We used a differential amplifier to monitor and amplify the ratio of the two photocurrents from the photodiode and to provide a signal that indicated the position of the transmitted light spot on the detector. The large-area photodiode we used was a commercial device — from On-Trak Photonics Inc. of Lake Forest, Calif. — whose accuracy in detecting the position of a light spot is about 0.1 μm. The product of the Fabry-Perot’s spectral gradient and the photodiode’s positional accuracy shows that a wavelength resolution of about 0.3 pm is feasible for this configuration.
As we tuned the wavelength of the light incident upon the chip, we recorded the data (Figure 2c). The incoming beam illuminated only ~3.5 mm of the 5-mm-long chip, so our data covered a 100-nm spectral range. Had the incoming beam illuminated the whole chip, we could have realized its full 150-nm spectral range.
Tweaking the design
In general, there are many parameters that allow tweaking the concept for a particular application. The properties of the structure providing the position-sensitive transmission determine the trade-off between high spectral resolution and spectral range. The large-area photodiode used as the position-sensing device in our demonstration is ideal for providing a linear response over a broad spectral range. Alternately, a photodiode array is better suited for high sensitivity and a small spectral range because these factors are determined by how fast the intensity distribution moves across the borderline between two photodiodes.
Ideally, the entire detector chip should be illuminated uniformly but, in practice, this scheme will work even with nonuniform illumination.4 The design parameters of the coating (full width half maximum and gradient) and the dimensions of the detector can be chosen such that the insertion loss of the wavelength detector is 50 percent or even less.
By choosing suitable materials for the detector and coating, a wide spectral range from the deep-ultraviolet to the far-infrared and even into the terahertz range is addressable. The wavelength detector can be limited to a size only slightly larger than that of the photodetector. Fabrication requires only conventional, readily available processing technology, which should enable cost-effective manufacturing.
Wavelength monitoring
We have used the system described above to monitor the output wavelength of a commercial vertical-cavity surface-emitting laser (VCSEL) from ULM Photonics of Ulm, Germany. The output wavelength was near 950 nm, and we could tune it by 5 nm by changing the VCSEL current (fine tuning) and by cooling or heating it with a thermoelectric cooler (coarse tuning). We coupled the output light from the VCSEL into a single-mode fiber, which was directed onto the wavelength detector without additional optics (Figure 3c).
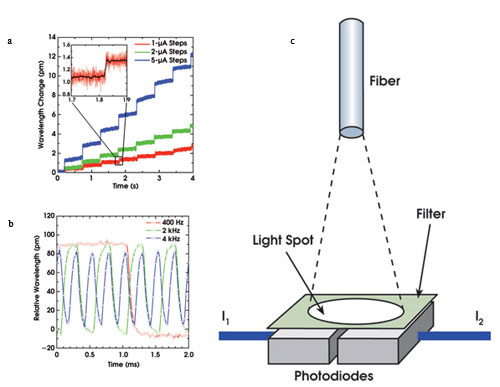
Figure 3. Light emitted by the VCSEL is coupled through an optical fiber onto the detector chip (c). The system can detect subpicometer wavelength shifts at a 50-kHz sampling rate (a). High-speed VCSEL frequency shifting yields information about the detector’s response time (b).
The wedged Fabry-Perot coating had a spectral gradient of 4 nm/mm, and the position-sensitive detector in this demonstration was a photodiode array from Hamamatsu consisting of 16 elements measuring 1 × 1 mm. A shift of the intensity distribution behind the coating caused changing intensity ratios between adjacent photodiodes. Therefore, the differential readout of two neighboring pixels with a differential amplifier was a measure for a wavelength shift.
As we changed the VCSEL’s wavelength in small steps, we recorded the output of the differential amplifier at a 50-kHz sampling rate and converted the readings into wavelength shifts using a calibration factor based on the filter’s properties. Figure 3a demonstrates that subpicometer steps can be measured easily with this detector. Tuning the VCSEL current in 1-μA increments changed the wavelength by approximately 0.25 pm, as can be seen in the inset. The inset also shows that averaging greater than 50 adjacent data points improves the signal-to-noise ratio and enables 0.1-pm resolution at a 1-kHz sampling rate.
Next, we repeatedly switched the VCSEL between two output wavelengths with different frequencies to learn more about the response limitations of the system. Figure 3b shows the data for switching frequencies of 400 Hz, 2 kHz and 4 kHz. The 2-kHz curve still reaches the saturation value of the 400-Hz curve, whereas the 4-kHz curve does not, indicating that the readout electronics are not fast enough to follow the wavelength changes at 4 kHz. In fact, the 3-dB frequency of the differential amplifier is specified for 15 kHz, which is in good agreement with these results. Improving the electronics would result in a much faster read out.
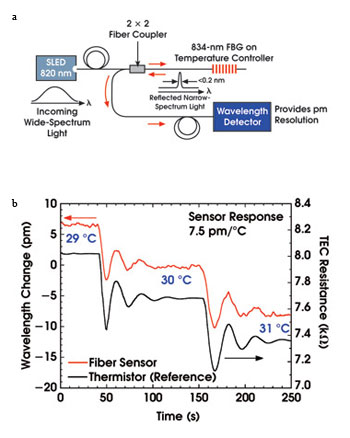
Figure 4. Illuminated with a broadband LED, the fiber Bragg grating FBG reflected a narrow band to the wavelength detector (a). The data from the experimental detector showed good agreement with the reference thermistor (b).
As a second example, we demonstrated our precise wavelength detector as it might be used in the field, with a fiber Bragg grating temperature sensor (Figure 4a). The data we collected, shown in Figure 4b, closely track the reference data from a thermistor. The small deviations between our temperature readout and the thermistor’s are real because the grating and the thermistor were not close enough to experience exactly the same temperature changes. Our detector consistently and accurately measured the grating’s wavelength shift of 7.5 pm/°C. The detector response and readout noise were 1.6 mV/pm and ~0.5 mV, respectively, enabling a temperature resolution of ~0.06 °C.
This resolution is comparable to that of state-of-the-art, commercial fiber-interrogation units.
Acknowledgments
The authors acknowledge the support of Setu Mohta (summer intern at PARC) and helpful discussions with Wolfgang Ecke and Hartmut Bartelt from the Institute for Physical High Technology in Jena, Germany.
Meet the authors
Peter Kiesel is a principal scientist at PARC in Palto Alto, Calif.; e-mail: [email protected].
Oliver Schmidt is a doctoral candidate at PARC; e-mail: [email protected].
Noble Johnson is manager of the optoelectronics group at PARC; e-mail: [email protected].
References
1. B. Lee (2003). Review of the present status of optical fiber sensors. OPT FIBER TECH, Vol. 9, pp. 57-59.
2. A. Othonos (1997). Fiber Bragg gratings. REV SCI INSTR, Vol. 68, pp. 4309-4341.
3. P. Kiesel et al (2006). Compact, low-cost, and high-resolution interrogation unit for optical sensors. APPL PHYS LETT, Vol. 89, 201113.
4. O. Schmidt et al (2007). Resolving pm wavelength shifts in optical sensing. APPL PHYS B: LASERS OPT, Vol. 86, pp. 563-600.