Lawrence Green, industrial product sales manager, Ophir-Spiricon Inc.
Beam shaping techniques enable both the manufacturer and the end user of laser materials processing systems to custom design both the spatial and the temporal profile of the laser beam for optimum performance for the application.
There are an increasing number of examples of this technique in the literature. The success of this technique is highly dependent on the performance of the laser relative to the beam shaping technique employed.
Modern laser materials processing places great emphasis on the stability of the laser source prior to modifying the spatial intensity profile [1]. For example, when drilling vias in multilayer circuit boards, each laser pulse needs to be accurately controlled based on whether the beam is processing copper or fiberglass layers. When welding thin materials to one another, the location of the focus is absolutely critical. Similarly, when seam welding dissimilar thickness materials, the diameter of the laser beam must remain constant through the entire weld.
The modern industrial laser is significantly more robust, stable and controllable than lasers produced only a few years ago. Better laser cavity design and construction, power and cooling supplies, and laser pumping technology all contribute to these advances. As a result, the beam produced is more stable and controllable than ever before. New advances in CO2 industrial laser design have resulted in higher efficiency sources with excellent mode quality. The scientific laser has also experienced similar advances. The fiber laser, once only a laboratory curiosity, has established itself as a source with excellent beam mode quality, and has been successfully employed in both the scientific and industrial market. New ultrashort pulse lasers in the femtosecond and attosecond range provide a means for studying many chemical and biological processes. Beam shaping can now be used with modern lasers to achieve spatial intensity profiles for process-specific applications with fairly predictable results.
W. Edwards Deming is widely credited with improving production in the United States during World War II and is regarded as a "Quality Guru" who aided the Japanese recovery after the war. Among his famous quotes are, “Any process you cannot measure, you cannot control” and, “If I had to reduce my message for management to just a few words, I’d say it all had to do with reducing variation” [2]. This philosophy directly applies to beam shaping in laser materials processing.Most materials processing involving either ablation or melting are proportional to the intensity of the source to the second power (squared). Since the intensity itself is proportional to the beam width, it is important to note that a small change in the beam width or the spatial intensity profile will result in a much larger result at the target. If an ablation process requires a beam with equal intensity over the entire beam, then it follows that measuring the spatial intensity variation is the only way of validating this requirement. For those processes where a pure Gaussian profile is required, verifying the size, shape and repeatability of the beam is critical to the success of the process. In addition to the size, shape and repeatability of the beam, the pointing stability is equally important.
Spatial Profiling of Focused Spots
Spatial profiling of unfocused laser beams have been done for more than twenty years, and the basic techniques are fairly well understood. At last count, there are more than 30 vendors who provide laser beam diagnostic software or instrumentation. It follows that the advantages of spatial profiling at the ‘raw’ beam level have been clearly demonstrated and are in use worldwide. With the addition of new beam shaping techniques, merely proving that the raw beam is stable and well shaped does not give the end-user enough information about the spatial intensity profile at the workpiece (or target). Fortunately, the major suppliers of beam profiling systems have been developing new methods for measuring beams at and near focus, and have commercialized new systems that achieve these critical goals.
In order to image a beam at focus, one needs to understand the special challenges of the environment at and near the focus, and how they affect the design and implementation of spatial profiling systems. Obviously, the irradiance of the beam in this region is the major factor in determining how to image the beam. Next, the size of the spot at focus must be considered. Finally, the wavelength, pulse duration and pulse frequency must be known in order to implement a successful system.
The schematic diagram in Figure 1 illustrates the common methodology used to profile all laser beams. It will be used throughout this paper.
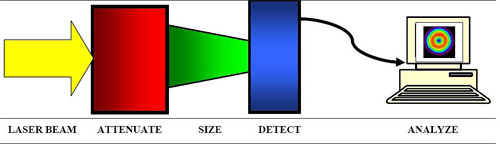
Fig 1: Schematic showing the major elements of any beam profiling system. This technique can be used to determine the correct configuration for any laser profiling problem.
There are two major electronic techniques used to image laser beams, mechanical scanning devices and camera based systems. Mechanical scanning devices employ moving slits, wires or pinholes to both attenuate the beam and to sample it, while camera-based systems image the beam that reaches the array. A mechanical scanning system must assemble a beam image after making multiple passes through the beam. This limits the number of images that can be displayed and generally not considered to work in real time. Further, they are not suitable for pulsed lasers. Camera-based systems image the beam at the frame rate of the camera, up to 100 frames per second. The images produced enable the user to view short-term transient effects of the laser. This paper will concentrate on camera-based systems as it is generally acknowledged that they can yield more detailed, real-time profile information. Fig. 2 shows some typical mechanical scanning instrumentation.
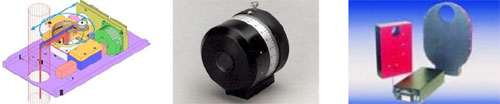
Fig 2: Mechanical scanning devices produce composite images as a result of the mechanical element passing through the beam. The maximum update rate is usually not fast enough to view the transient laser response.
Until a few years ago, CCD camera choices were limited. Ghost images when using CCD cameras with pulsed Nd:YAG lasers were common and the pixel size (spacing) was too large to be of much use for focused spot measurements (in order to make a robust measurement of beam width, at least 16 x 16 pixels should be illuminated). For a CCD camera with 13.5 μm spacing, this limited the measurement to about 250 µm. Even at 10 micron spacing, the smallest measureable beam width is only 160 μm. Unless the user was willing to pay a premium of many thousands of dollars, digital cameras were almost non-existent and cumbersome to set up. Nevertheless, using the few cameras available coupled with sophisticated software enabled the early adopters of this technology to obtain reproducible, detailed and accurate images.
Commonly available focal plane arrays today have pixel sizes of as small as 4.4 μm. This enables accurate measurement of beams as small as 70.1 μm without additional optics. In addition, these cameras now are available with both IEEE 1394b FireWire and USB-II interfaces. This adds a dimension of flexibility and portability unheard of less than five years ago, as these cameras can be connected to laptop computers for field measurements. Ghosting is still an issue due to inadequate optical isolation between the charge-coupled layer and the silicon layer. For this reason, new camera candidates must be thoroughly tested to ensure they do not exhibit ghosting when used with 1064 nm pulsed lasers.
For most near IR applications, the laser power range is from a few watts to little less than 1 kW. Most of these use focusing lenses from about 80 mm to about 175 mm. For lasers with excellent mode quality, M2 less than 10 for example, longer focal length lenses can be used to achieve the same spot size. In those applications where the laser beam is fiber-delivered or in the case of the fiber laser, the beam diameter can range from 100 microns to about 500 μm. In order to successfully profile a focused spot with a camera based system, special attention must be given to the attenuation of the incoming beam. If the laser is pulsed, one can either have long (2 to 8 ms) pulses from a few Hz to about 100 Hz, or in the case of the Q-Switched laser, pulses of 10 to 30 ns are not uncommon with frequencies from a few Hz to many hundreds of Hz. This provides a basic set of ‘envelope parameters’ from which beam profiler instrumentation must be supplied.
Generally there are only a few methods available to properly attenuate the beam. The easiest by far is to use front reflecting flats or wedges. These will reflect about 4 percent of the incoming beam, and transmit the remaining 96 percent. UV-grade Quartz wedges have been used for many years in the lab, and their properties are well understood.
For focused spots however, the size and spacing of the wedges relative to each other is critical. In addition, since the front reflection is polarization-sensitive as shown in Fig. 3 they are usually used in pairs. Fig. 4 shows the general layout of one set of optics. It should be noted that it is possible to further reduce undesired reflections by A/R coating.
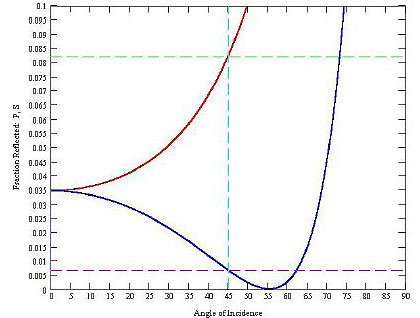
Fig 3: Flats and wedges are polarization-sensitive. Unless used with fiber-delivered beams, they should be used in pairs to eliminate polarization selectivity.
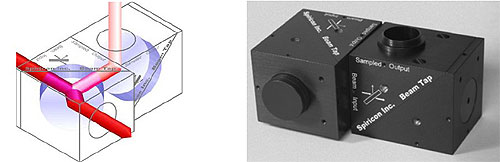
Fig 4: Schematic diagram shows the reflected beam path used to attenuate the beam.
While the accessory in Fig. 4 will attenuate beams up to about 100 W, the path length from the entry of the first beam cube to the exit of the last beam cube make them unsuitable for most focused beam applications. A new design, shown in Fig. 5, reduces the beam path length to less than 100 mm.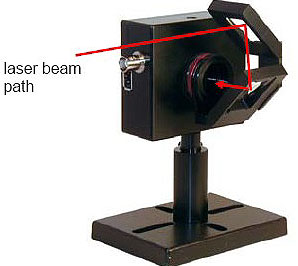
Fig 5: Addition of close-coupled two wedge accessory to camera reduces path length from input to array to less than 100 mm. the wedges can be supplied with a 1 percent polarization-independent coating, and can be stacked.
In spite of the short path length of the accessory in Fig. 5, it is apparent from working with numerous focusing head assemblies, that the focusing lens is usually recessed into the body of the focusing head. For these applications a novel addition to the existing accessory was developed. The focused spot accessory mounts to the wedge accessory, and enables the user to image not only spots from short focal length lenses (sometimes as short a 50 mm) but it also enlarges the resulting spot by almost a factor of two, enabling the imaging of beams as small as 35 μm.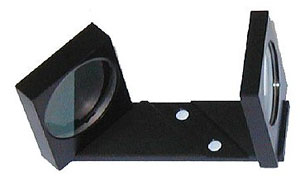
Fig 6: Focused Spot Accessory uses a negative lens to enlarge and extend the location of the focused spot.
In order to understand the mechanism that extends the beam, Fig. 7 shows the basic concept used to translate the focus. A spreadsheet is also available from the manufacturer to make ‘what if’ calculations to determine the best focal length of the negative input lens.
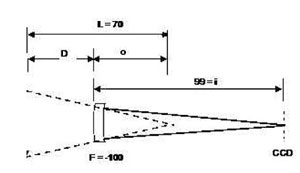
Fig 7: Basic relationship used when using a negative input lens to translate the focus.
For CO2 lasers, the situation becomes far more challenging. Most CO2 applications employ lasers in the kW power range with focused spot sizes from 100 to 1000 μm. Focal lengths of the focusing optics however are longer, from 200 to 300 mm. It will be shown why this is an advantage when measuring focused CO2 spots. Typical focal plane arrays available for use in the 5-14 μm band are either ferroelectric "microbolometers" or pyroelectric detectors. While the mircobolometer may have pixel spacing as small as 25 μm, the baseline stability and high sensitivity of these devices makes them unsuitable for making quantitative beam width measurements. For this reason, the mainstay of the mid- IR applications is the pyroelectric array, shown in Fig. 8.
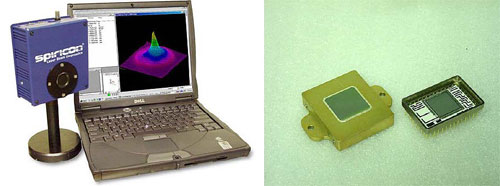
Fig 8. Pyroelectric arrays can image Infrared energy all the way out to 3,000 μm, and are extremely stable.
The pyroelectric detector can actually detect energy over a wide band of wavelengths[1], from soft x-ray at one end of the spectrum to terahertz (1000 μm or higher) at the other, although the primary use for this device is in the range form 1-1000 μm. This camera has been the subject of many studies, and the details of the camera can be found in the references.
The pixel spacing of this device is 100 μm, however, and that limits the usefulness of the camera for focused post measurements. Referring to the schematic in Fig. 1, the technique will require attenuation of the beam before it reaches the focus, AND enlargement of the beam so that it can be properly imaged on the camera. Fig. 9 shows a newly developed CO2 microscope objective that enlarges the beam by a factor of 10 so that a 300-μm spot appears on the camera as a 3.00 mm spot. This is more than sufficient for the camera to detect and accurately determine the beam widths.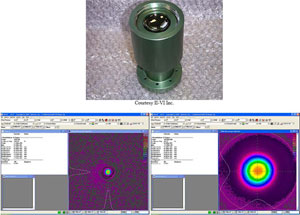
Fig 9: 10X microscope objective using IR optics enlarges the spot so the Pyrocam can image 150-300 μm spots. Images are shown with and without the lens.
A new device has been designed in order to attenuate the beam, shown schematically in Fig. 10. Using nothing more than existing optics, it is now possible to attenuate multi kW beams so that the resulting image can be presented to the microscope objective.
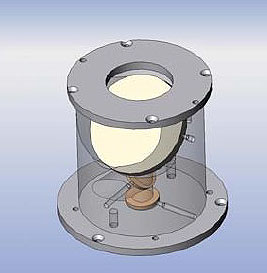
Fig 10: CO2 attenuating accessory (Patent Applied) fits in only 200 mm space after focusing optic and can attenuate multi kW lasers. Image courtesy of A-L-E. Inc.
It should be noted that this design can also be applied for use with higher power near IR lasers, in the range of 1064 to 1070 nm merely by changing the attenuating optics.
For those applications where the focused beam is either inaccessible or is too large, as in the case of high power direct diode lasers and UV applications, direct imaging is unsuitable. In these cases, the technique of imaging the scatter from a Lambertian surface [3,4,5] has proven to be successful . While the technique is easy to set up and use, the irradiance of the beam at focus must be taken into consideration. As long as the power density is low enough not to damage the scattering surface, then this technique can be used. Potential users should contact qualified scatter surface manufacturers [6] to have them determine the applicability of the technique for their beam.
Temporal Profile
Pulse shaping is now available from most laser manufacturers as a way to adjust the energy of the laser pulse to the material being processed. One such example is temporal pulse shaping when drilling multilayered materials, as the laser pulse can be tailored to ablate each layer selectively. Most applications concentrate on this technique. Yet, it has been shown[7] that the transient response of the laser as the shutter is opened is related to the performance of the process as well. In fact, there are two temporal profiles to consider, the instant response of a single pulse, usually measured in milliseconds, and the longer term transient response of the laser during the process itself, in seconds.
Devices for temporal profiling are simple to obtain, install and observe, as most near IR applications use fast photodiodes (FPD). For those applications in the mid-IR range, there are a limited number of vendors who can supply detectors with similar temporal response characteristics, but up to 10 μm or more. A typical temporal profile is shown in Fig. 11.
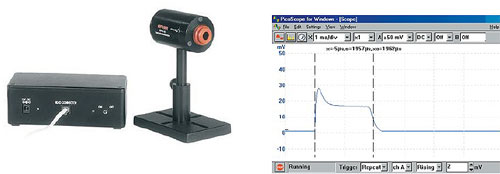
Fig 11. Temporal profile instrumentation is easy to use, and shows each pulse.
In order to demonstrate the powerful ability of these techniques, the following actual examples are provided. Each will be summarized with pertinent laser data so the reader can determine if these techniques are suitable for their application.
Example: Lamp Pumped Nd:YAG Laser, Fiber Delivered
The most commonly used near IR source until recently has been the standard, flashlanp-pumped, Nd:YAG laser. For this application, only the power level, focal length of the lens, and the final spot size is necessary to determine the appropriate instrumentation. In this case, the laser shown operates at about 10 W average power, the lens focal length was 120 mm. The focused spot size was expected to be 170 μm.
The objective of this application was to show that the beam was top hat in shape. Testing the laser with the negative lens accessory and the double quartz wedges demonstrated that the beam was almost top hat at the focus. When the beam was imaged in the near and far field (only 250 μm from focus) some startling changes occurred. Figs 12 to 14 show the beam profiles at the three locations.
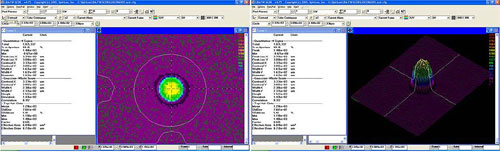
Fig 12: 2-D and 3-D images of the initial measurement taken at the focal point. The calculated beam width is 163 μm.
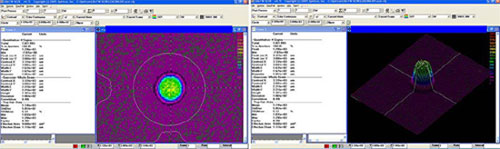
Fig 13: Beam profiles 250 μm into the near field. The beam size changes little, but the shape is more top-hat.
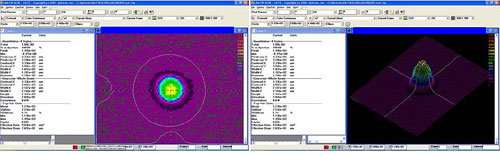
Fig 14: Beam profiles 250-μm into the far field. The most intense part of the beam is 40 percent smaller while the overall width of the beam is 10 percent larger.
The next example is from a fiber-delivered, Nd:YAG laser. The objective was to quantitatively measure both the size and shape of the beam at focus and to demonstrate new shaping optics. Fig. 15 shows the beam with conventional optics, and Fig.16 shows the beam with the new optics. The beam width in these examples was about 350 μm.
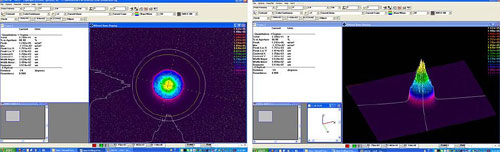
Fig 15: 350-μm spot at 57 W with conventional optics. The beam is nearly Gaussian.
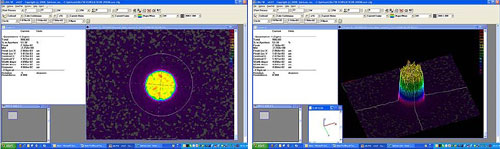
Fig 16: 420-μm spot at 57 W with new beam shaping optics. The beam is nearly top hat.
Example: Excimer Laser, Using Fluorescent Target
The next example is of an excimer laser at 248 nm. Because the beam was shaped for ablation, the uniformity of the beam was critical. In this case, a fluorescent plate was used to convert the UV energy into the visible range, and then the CCD camera was fitted with an ordinary CCTV lens. Fig. 17 shows the beam before adjustment, and Fig. 18 shows the same beam after readjusting the laser. The difference in the uniformity of the irradiance is easily quantified.
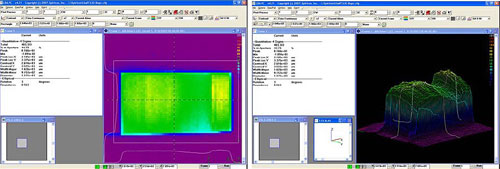
Fig 17: 2-D & 3-D images of the excimer laser before beam adjusting. There is a quantifiable loss of irradiance on one side of the beam.
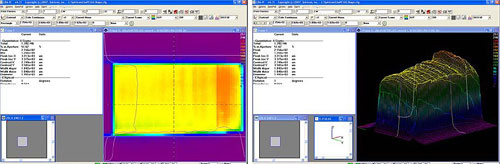
Fig 18: Same excimer laser after initial tuning. The area of low irradiance has been almost eliminated.
Example: 4 kW Direct Diode Laser, 808 nm, Using Scattering Target
The next example[8] shows the usefulness of a specially prepared Lambertian surface. In this example, the direct diode laser has a short focal length, making it almost impossible to use any attenuating optics. For this application, a spinning Lambertian surface was used, shown here in Fig. 19.
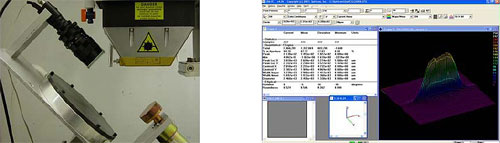
Fig 19: Setup for imaging 4 kW direct diode laser onto Lambertian surface. The surface spins to eliminate ‘speckle’, which causes imaging artifacts. By adjusting the 4 power supplies, the irradiance uniformity was improved.
Example: 5 kW CO2 Laser, 10.6 μm, Using High Reflection Optics
The final example shows the ability of using a compact high reflective optics accessory, shown in Fig. 10, with the CO2 microscope objective, shown in Fig. 9 to image high power CO2 lasers. The system was fitted with the CO2 beam attenuation accessory, and the focused spot of a 5 kW laser was directed to the pyroelectric camera. Fig. 20 shows a typical beam at 3 kW.
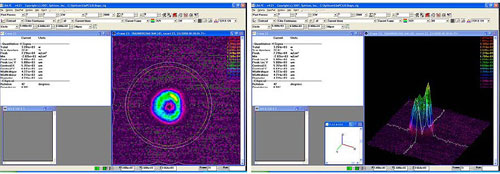
Fig 20: 3 kW CO2 laser beam image showing the focused spot of about 400 μm. The ‘hot spot’ on one side is clearly visible.
Summary
While there are many methods to modify a laser beam shape, it is essential for the user to quantitatively characterize the shaped beam at the focus, or the process for which it is intended is at risk. Using well-known and generally accepted measuring techniques provides the user with the tools necessary to properly characterize the beam before and after such shaping routines are applied, and to validate the effects from day to day. Quantitative measurement also provides proof that the technique has been successful, and also can provide valuable information to the diagnostician so that potential problems can be rapidly resolved when they inevitably occur. In addition, as these techniques translate to the manufacturing floor, they can be used to continuously monitor the beam for in-process changes to lower or eliminate scrap material, and increase productivity and profitability.
For more information, visit: www.ophiropt.com
Meet the Author...
Larry Green is the Industrial Product Manager for Ophir-Spiricon Inc. with over 20 years of industrial experience, and eight years in the laser industry. His multidisciplinary background includes power generation, wastewater treatment, scientific instrumentation, thermal analysis and rheology. For the past eight years, Larry has designed beam-profiling instruments for industrial laser processing. A native of New York, Larry holds a bachelor of engineering sciences from the State University of New York at Stony Brook and a masters of science from The Polytechnic Institute of New York.
REFERENCES
[1] Roundy, C. B., Green, L., "Beam profiling monitors beam shaping," Proceedings of SPIE Vol. 5876, 587604 (2005).
[2] “Deming- A Living Article” American Association for Quality 2008.
[3] Lineton, W., Green, L. I., "A new method for direct imaging of high power near IR lasers," Proceedings of SPIE Vol. 5708, pp. 151-159 (2005)
[4] Eric, J., Seibert II, D. B., Green, L. I., "Novel method to sample very high power CO2 lasers: II Continuing Studies," Proceedings of SPIE Vol. 5708, pp. 160-169 (2005)
[5] Lander, M., Green, L. I., "Novel method to sample very high power CO2 lasers," Proceedings of SPIE Vol. 5333, pp. 79-86 (2004)
[6] SPAWR Industries Inc. -Optics Division, 2051 Spawr Circle, Lake Havasu City, AZ 86403
[7] Green, L. “Process Monitoring of Industrial CO2 Lasers, Current State of Technology”, ALAC 2004.
[8] Lineton, W., Green, L. I., "A new method for direct imaging of high power near IR lasers," Proceedings of SPIE Vol. 5708, pp. 151-159 (2005)