Förster resonance energy transfer (FRET) provides a powerful tool for revealing interactions between molecules on a subcellular level.
Jeffrey M. Larson and Dr. Jennifer L. Peters, Nikon Instruments Inc.
FRET is an energy transfer between two fluorescent molecules that
occurs without the exchange of a photon. It occurs when a fluorescent molecule,
usually called the donor probe, is excited by the absorption of a photon. If a fluorescent
probe that can be excited by the energy held in the excited state of the donor molecule
is very near, resonance energy transfer can occur between the molecules. This second
molecule, called the acceptor probe, usually decays to the ground state by the emission
of a photon of a longer wavelength than that expected from the donor probe.1
The FRET signal is the fluorescence from the acceptor
probe stimulated by a resonance transfer from an excited donor molecule. Because
FRET requires the donor and acceptor probes to be within 50 nm and to have closely
aligned dipoles, the technique can be used to see if tagged molecules are interacting.
This is the primary way it is used by biomedical researchers.
FRET can be detected in a number of
ways. Sometimes a fluorescence microscope equipped with filters appropriate for
detecting the emissions of both the donor and acceptor probes is used. Confocal
fluorescence microscopes are more widely used because they can acquire data in very
thin optical sections, allowing the locations of interacting fluorescent probes
to be highly resolved axially and laterally.
FRET by wavelength
In standard confocal microscopes, two or three
fluorescence emission channels are defined by wavelength. In a FRET experiment involving
cyan fluorescent protein (CFP) as a donor and yellow fluorescent protein (YFP) as
an acceptor, one emission channel would likely range from 450 to 490 nm and be referred
to as the donor channel. The acceptor channel would likely be from 530 to 580 nm.
Unfortunately, these are simply “cyan”
and “yellow” detection channels, not really CFP and YFP channels. The
photons detected can originate from nonsignal fluorescence such as autofluorescence
— fluorescence from sources other than the probes of interest. The acceptor
channel can contain photons emitted by the acceptor molecule as well as spillover
from the donor probe (Figure 1).
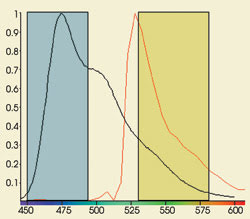
Figure 1. The acceptor channel can contain
photons emitted by the acceptor molecule as well as spillover from the donor probe,
as seen in this graph of CFP (black) and YFP (red) emission.
Powerful algorithms have been developed
to identify the sources of photons in the donor and acceptor channels and to calculate
FRET efficiency from these data. However, such methods can be cumbersome and time-consuming
because they require a minimum of eight images to be acquired.2
For the algorithms to remove the donor
fluorescence in the acceptor channel, images of a donor-only specimen excited by
the donor laser must be acquired in both the donor and acceptor emission channels.
Images of an acceptor-only specimen excited by donor and acceptor lasers also must
be acquired in both emission channels so that excitation of the acceptor probe by
the donor laser can be identified and removed. Fluorescence from the acceptor probe
that appears in the donor channel can be identified and removed as well, allowing
the true FRET signal to be calculated.
Finally, images of the “FRET”
specimen (the specimen with both donor and acceptor probes) must be acquired in
the donor and acceptor emission channels using the donor laser and in the acceptor
channel using the acceptor laser.
The image of the acceptor probe excited
by the acceptor laser identifies the location of the acceptor molecule, while the
image of the donor probe excited by the donor laser shows the location of the donor
probe. FRET can occur only where both the donor and acceptor probes are collocalized.
The acceptor channel image acquired using the donor laser is usually referred to
as the uncorrected FRET image — the one image from which the corrections or
subtractions are made. Sometimes it may also be necessary to subtract background
images where autofluorescence is a problem.
FRET calculations are complicated,
and the algorithms do not always provide the expected result. At times, so little
is left in the FRET image after the corrections are subtracted that the signal barely
rises above the noise. It would be much easier to calculate FRET efficiency from
data quantifying the fluorescence of the actual donor and acceptor molecules than
from data in channels defined by wavelength.
Spectral FRET
Spectral FRET is a term for methods relying on
data defined by the probe rather than by emission channels, and linear unmixing
is a way to accomplish such measurements. Linear unmixing is a mathematical process
in which the spectrum at each pixel is compared with reference spectra and the component
spectra identified. The proportion of the intensities associated with each component
is calculated by linear regression.
Spectral FRET data is acquired somewhat
differently from the standard method using acquisition channels defined by wavelength.
A spectral profile is created so that all wavelengths comprising the emission spectra
of both the donor and acceptor probes can be acquired at high spectral resolution.
For the CFP/YFP FRET pair, the spectral data is acquired in 32 channels, each 5
nm wide, from 450 to 610 nm. These channels cover nearly all of the emission spectra
of both probes with high spectral resolution and high signal-to-noise ratio. All
channels are acquired in a single scan because, if they were acquired in series,
the photodamage that increases with each scan would distort the spectrum.
Reference spectra to be used in unmixing
are acquired from single-label donor and acceptor specimens. It is not necessary
to acquire an acceptor channel image from the donor specimen because no acceptor
molecules are present. A blank image can be substituted in software requiring input
for that image.
By the same reasoning, only an acceptor
image is required from the acceptor specimen. Images of acceptor fluorescence stimulated
by the acceptor laser and images of both donor and acceptor fluorescence stimulated
by the donor laser must be still acquired from the FRET specimen. The only processing
necessary is the removal of acceptor fluorescence directly stimulated by the donor
laser from the uncorrected FRET image. Data acquisition is simplified, and subtractive
processing required of the algorithm is minimized. Signal-to-noise also improves
because the nearly full spectral bandwidth of the donor and acceptor probes is sampled.
The Nikon C1si spectral confocal microscope
can be used to perform linear unmixing (Figure 2). It acquires spectral data in
up to 32 channels in a single scan at a user-specified wavelength sampling increment
of 2.5, 5 or 10 nm.
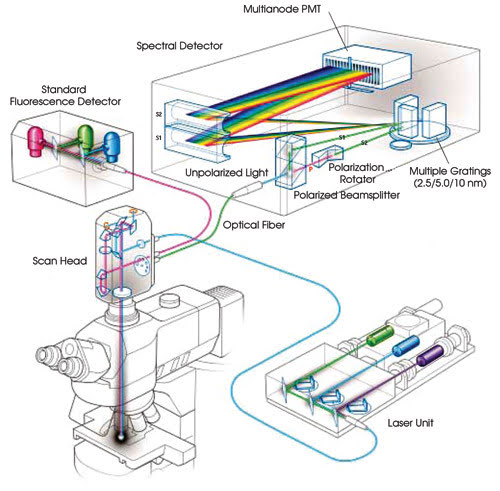
Figure 2. This system diagram illustrates the optical path through
the spectral detector module.
The 5-nm channel width is most often
used for unmixing fluorescent probes with overlapping emission spectra because it
offers the best balance among sampling bandwidth, spectral resolution and sensitivity.
The 10-nm channels are typically used to acquire images where there are four or
more fluorescent probes. The 2.5-nm channel width is used when the emission peak
wavelength must be known with great precision.
The spectral detector is coupled to
the scan head through a multimode optical fiber with a 50-μm core. A lens with
a long focal length focuses an image of the core on a Hamamatsu 32-element multianode
photomultiplier tube. Emission photons are split into two spatially separated and
orthogonally polarized beams.
The s-plane polarized beam travels
directly from the beamsplitter to the diffraction grating. A prism rotates the p-plane
polarized beam to the s-plane. This improves sensitivity because light polarized
to the s-plane is diffracted with greater efficiency than p-polarized light. The
efficiency of the grating also is nearly flat, between 95 and 98 percent of optimum,
for light polarized to the s-plane for the most important part of the spectrum,
500 to 680 nm.
Both beams, now polarized to the s-plane,
are diffracted at the same spot on one of three gratings in the detector. The selected
grating is precisely positioned so that the selected spectral bandwidth is imaged
across the multianode photomultiplier tube.
Spectral confocal microscopes were
first used to separate the signals from fluorescent molecules with highly overlapping
emission spectra. Many specimens of biological interest also contain autofluorescent
molecules that can mask or interfere with detection of the signal from the molecule
of interest. To remove autofluorescence background by linear unmixing, a spectrum
of the interfering autofluorescence is acquired. The autofluorescing molecules are
treated as any other fluorescent molecule. After unmixing, the autofluorescence
can be either displayed in a unique color at reduced intensity or dropped from the
final image.
Raad Nashmi in Henry A. Lester’s
laboratory at California Institute of Technology (Caltech) has used the C1si to
separate the YFP signal in mouse brain genetically modified to express nicotinic
acetylcholine receptor at endogenous levels in brain from autofluorescence background.
The challenge in removing this autofluorescence is that it is significantly brighter
than the YFP signal of interest (Figure 3).
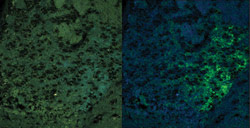
Figure 3. The brain of a genetically
modified mouse is expressing a YFP-tagged nicotinic acetylcholine receptor at endogenous
levels. A true color projection is shown on the left. An unmixed image shows the
YFP-tagged receptor in green and the background autofluorescence that was removed
by unmixing on the right.
The microscope also can be used to
perform another FRET imaging method: acceptor photobleaching. Photobleaching the
acceptor molecule removes donor interaction with it as a possible decay pathway
for an excited donor molecule. With that pathway removed, the fluorescence intensity
of the donor molecule of the FRET pair increases.3 This method is even easier to
execute than the simplified spectral FRET acquisition method described earlier.
Using the fluorescence recovery after
photobleaching (FRAP) module in the microscope’s software, one or two reference
images of the donor and acceptor are acquired using the minimum laser power consistent
with acceptable signal-to-noise ratio. A region of interest is drawn where FRET
is expected to occur. The acceptor laser power is set to 100 percent, and the acceptor
fluorescence in that region of interest is bleached out in as few scans as possible.
A number of postbleaching images are acquired and analyzed for FRET. Once set up,
the entire experiment can be executed with the click of a single button.
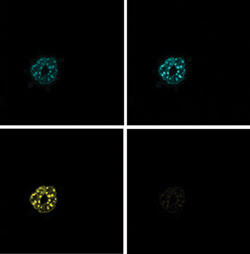
Figure 4. Acceptor
photobleaching was performed on mouse embryonic fibroblasts expressing CFP and YFP
constructs of the basic leucine zipper transcription factors C/EBP·DBD. This
technique produces a prebleaching donor image (top left), a postbleaching donor
image (top right), a prebleaching acceptor image (bottom right) and a postbleaching
acceptor image (bottom left).
Spectral FRET acquisition and unmixing
using C1si was demonstrated at the Workshop on FRET Microscopy that director Ammasi
Perisamy held in the W.M. Keck Center for Cellular Imaging at the University of
Virginia in Charlottesville in March. The acceptor photobleaching experiment was
performed there using specimens provided by Richard N. Day, also of the university.
As before, reference spectra acquired
from single-label donor and acceptor specimens are used to unmix the images of the
result (Figure 4). The postbleaching spectrum shows that donor fluorescence increased
by 20 percent after photobleaching the acceptor fluorescence down to less than 10
percent of its original intensity (Figure 5). The images accompanying the graph,
unmixed from the pre- and postbleaching data, show increased donor probe fluorescence
and greatly reduced acceptor fluorescence after photobleaching of the acceptor probe.
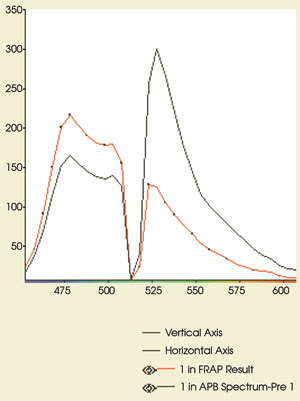
Figure 5. These emission spectra
are from the experiment in Figure 4. The CFP and YFP emissions are shown before
(black) and after (red) acceptor photobleaching. Note the increase in CFP fluorescence
(479-nm peak) after bleaching of YFP. The postbleaching spectrum shows that >90
percent of the YFP (530-nm peak) has been eliminated. Compare the postbleaching
spectrum with the CFP reference spectrum in Figure 1.
Nashmi at Caltech has used an acceptor
photobleaching method similar to the one described above to investigate subunit
assembly within a receptor and to examine the interaction between various receptors.
“There is significant overlap in spectral emission between CFP and YFP,”
he said. “Spectral unmixing will give us more accurate quantitative FRET measurements.”
Meet the authors
Jeffrey M. Larson is product manager for confocal
systems and Jennifer L. Peters is an applications scientist at Nikon Instruments
Inc. in Melville, N.Y.; e-mail: [email protected].
References
1. T. Förster (1965). Delocalized excitation
and excitation transfer, Modern Quantum Chemistry. O. Sinanoglu, ed. Academic
Press, pp. 93-137.
2. A. Periasamy (2001). Fluorescence
resonance energy transfer microscopy: a mini review. J Biomed Optics, Vol.
6, pp. 287-291.
3. P.I.H. Bastiens et al (1996). Imaging
the intracellular trafficking and state of the AB5 quaternary structure of the cholera
toxin. EMBO J, Vol. 15, pp. 4246-4253.