Various forms of spectroscopy are used to investigate the optical properties of tissue samples. Techniques such as diffused reflection and fluorescence spectroscopy are used to search for liver contaminants, to identify oils and lotions on skin, to separate normal tissue from tumors, and to confirm the quality of foodstuffs. Animal tissues, for example, reveal their water and lipid contents under the view of standard spectroscopy equipment because they absorb light at 972 and 930 nm, respectively.
New research shows, however, that optical spectroscopy techniques can be improved, expanded – and shrunk – making them increasingly useful in tissue research in the lab and in the clinic.
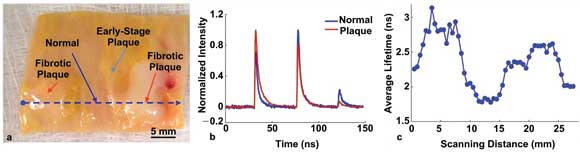
Dynamic scanning of an aorta using simultaneous time- and wavelength-resolved fluorescence spectroscopy reveals normal and diseased tissue.
Arterial breakdown
Arteries can be studied in a number of ways, including using fluorescence lifetime imaging microscopy (FLIM) to locate and characterize arterial plaques. Another technique for discerning healthy from diseased arterial tissue takes advantage of the autofluorescence exhibited by some molecules found within it. At the University of California, Davis, Laura Marcu and her colleagues have used this technique for several years to investigate atherosclerosis and other aspects of arterial health. In fact, time-resolved fluorescence methods have been in use since the 1990s, but Marcu identified a lingering problem with it.
“Overall, time-resolved fluorescence measurements in living systems are difficult to perform,” she said. The technique must be done in highly controlled conditions, and neither the fiber optic probe nor the target tissue can move at all without affecting results, making it impractical for clinical use. In addition, time-resolved fluorescence spectroscopy is notoriously slow at collecting and analyzing data.
To sidestep the downsides of time-resolved methods, Marcu’s group has added a wavelength-resolved component.
The system consists of a 337-nm nitrogen-based pulsed laser from Lasertechnik Berlin that emits 700-ps pulses at a repetition rate of up to 50 Hz. Both excitation light and fluorescence emissions pass through a fused-silica optical fiber. Fluorescence emissions are split to pass through three separate fibers – 1, 10 and 19 m in length – and then collected at a photomultiplier tube from Hamamatsu Corp. of Bridgewater, N.J.
Dichroic and bandpass filters also split the light into three bands chosen for optimal characterization of the signal from the fluorophores expected in each sample. For example, one set of filters helps look for signs of atherosclerosis, while another aids tumor diagnosis, Marcu said. Acquisitions took 200 ns to complete after each excitation pulse from the laser.
For ex vivo experiments, the researchers placed tissue samples on a custom positioning stage set to move the sample linearly at 1 mm/s. For in vivo experiments inside intact arteries, they placed the fiber optic probe in a catheter, using a side-viewing fiber.
They found that the combination of time and wavelength differentials worked in their favor when differentiating between normal and sclerotic tissues. One determinant was that fluorescence lifetime measurements over sclerotic plaques were more than 46 percent higher than those over normal tissue, owing to chemical differences between the two regions. Importantly, the investigators achieved reliable characterizations during catheter-based in vivo measurements, even when fluorescence intensity fluctuated greatly because of uncontrollable factors that affect light intensity, such as blood vessel geometry and the blood itself.
The group has dubbed its technique “simultaneous time- and wavelength-resolved fluorescence spectroscopy” and is working to further increase the speed of data collection by using a laser with a repetition rate of 1 MHz.
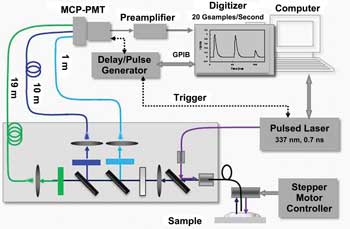
Diagram of a simultaneous time- and wavelength-resolved fluorescence spectroscope developed by researchers at the University of California, Davis. MCP-PMT = microchannel plate-photomultiplier tube; GPIB = general-purpose interface bus. Images reused with permission of Optics Express.
“The overall performance of the technique can be significantly improved by the availability of pulsed (subnanosecond) UV lasers working at high repetition rates (up to 5 MHz) and fast digitizers with fast data storage capability,” Marcu said.
The group described the system and reported its use in conjunction with ultrasound imaging, which provides structural information, in the Feb. 28, 2011, issue of Optics Express.
Downsizing
Improving the reliability of spectroscopic tissue analysis is important, but so, too, is making the devices small enough to be viable in clinics. A recent examination of compact diffuse reflection spectroscopy (DRS) systems performed at Duke University in Durham, N.C., may result in the most portable analysis tool yet for the task.
Traditional DRS equipment provides a wide array of experimental detection options but causes logistical issues of space, transport and storage, said Karthik Vishwanath of the school’s biomedical engineering department, where he and his colleagues focus on noninvasive cancer diagnostics.
“We realized that if we could build small, portable systems that could give us the same spectroscopic sensitivities, it would be possible to use methods of optical spectroscopy for biosensing easily in many clinical and preclinical studies to sense tissue function [and] morphology,” Vishwanath said.
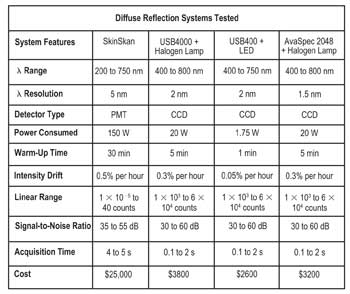
As they describe in the February 2011 issue of Applied Spectroscopy, the Duke researchers assembled three compact spectroscopy systems that operate in the 400- to 650-nm range and then tested each one’s system drift, linearity, signal-to-noise ratios and accuracy when used to probe tissue phantoms.
The core equipment for the trio of systems was a USB4000 spectrometer made by Ocean Optics Inc. of Dunedin, Fla., paired with a tungsten halogen lamp; the same spectrometer paired with a lab-built LED module; and an AvaSpec2048 spectrometer supplied by Avantes USA of Broomfield, Colo., used with the halogen lamp. The group compared its results with these systems to those from a full-size SkinSkan system made by Horiba Jobin Yvon of Edison, N.J. (see table).
 “We were surprised at how easy and quicker these smaller systems were to start up, calibrate and get using to collect data, relative to larger instruments,” Vishwanath said.
Ultimately, the group was pleased with the results. Not only were the fiber-based systems its members assembled much smaller than the commercial instrument – about one-tenth the size and cost – but the results were quite acceptable for tissue analysis. The signal-to-noise ratio of each system was greater than 30 dB, and source drift was negligible (comparable to the commercial system).
Of the three prototype combinations, the Ocean Optics spectrometer used with the very power efficient LED light source proved to have the best combination of portability, low power consumption and low relative cost. The group now plans to put together similarly portable systems that operate in the near-infrared and to build a “smart” optical probe that can correct for source intensity drift and other variations on the fly.
“With the constant improvements in solid-state electronics for detectors and LEDs, these systems could become really small,” Vishwanath said.
Extended range
Most spectroscopy involving tissue samples takes place in the roughly visible range of 500 to 1000 nm. With these wavelengths, one can identify many of the molecules that comprise basic tissues, whether skin or liver or cardiac samples. For some researchers, such as Rami Nachabé of Philips Research in Eindhoven and his colleagues there and at Erasmus Medical Center in Rotterdam, both in the Netherlands, the range isn’t enough.
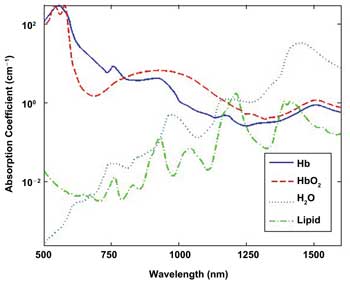
Scanning from 500 to 1600 nm provides more data for confidently identifying blood components. Hb = hemoglobin; HbO2 = oxygenated hemoglobin.
Knowing that there are additional useful chromophores that become apparent at wavelengths greater than 1 µm, Nachabé’s group began work on a system to extend the range well into the infrared.
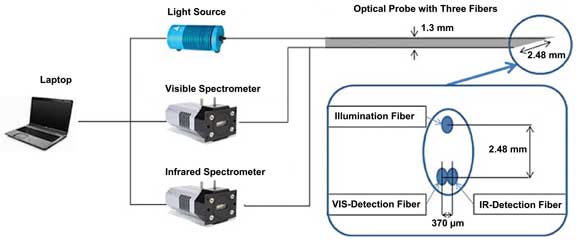
The researchers reported in the Nov. 22, 2010, issue of Optics Express that they based their work on a pair of spectrometers made by Andor Technology plc of Belfast, UK, including the DU420A BR-DD, which features a silicon detector, and the DU492A, which uses an InGaAs detector to read up to 1.7 µm. The former unit has a 255 x 1024-pixel array; the latter, a single row of 512 pixels. The investigators connected these to their light source and samples using an optical probe with three 200-µm-diameter fibers. They set the ends of the light-collecting fibers side by side 370 µm apart so they would collect from essentially the same area of the sample. The emitting fiber was placed 2.48 mm away, equidistant from the collection fibers.
Using both silicon- and InGaAs-based spectrometers helps extend the wavelength range – and, thus, resolving power – of tissue-component analysis.
The researchers used the system to gather data from various parts of live pigs, collecting nearly 300 measurements from both fatty and muscular areas. They found that adding the InGaAs detector to the data-collection stream boosted the statistical confidence of the estimation of water and lipid contents in the samples by up to four times. Furthermore, they suggest that scanning between 500 and 1600 nm would find nearly 100 percent of the chromophores available in any given tissue sample.
Dropping further below 500 nm – and going above 1600 nm – could clarify some further absorbers, however. Nachabé said that beta-carotene bilirubin and other molecules become apparent under 500 nm, whereas various proteins would be found at higher wavelengths in the infrared.
“From our first publication in the biological and medical field, a lot of research groups [have] expressed their interest in using extended wavelengths,” Nachabé said.