From the ice and snow of Antarctica to the daunting heights of the Andes Mountains or the effluent-choked waters of the Amazon, the world offers plenty of forbidding environments that beg to be investigated spectrally.
Identifying the fluctuating state of the environment is a massive undertaking that requires thousands of people to trek to some of the most desolate corners of the globe. From arid deserts to forsaken lakes and rivers and everywhere in between, the search is on for plants, minerals, water, soil and other materials that reveal the health of the ecosystem. These samples, once collected, are then chemically analyzed with hopes of determining not only their native states, but also whatever outside influences are taking a toll on them.
To find out, for example, how an oil spill may influence the aquatic life in a river delta or how acidic runoff from a gold mine might seep into wells that provide water to a town, collecting soil and water samples from a handful of sites no longer is satisfactory. Instead, environmental investigators increasingly collect spectrographic information from sensors implanted in the belly of an airplane, a helicopter or even a low-orbiting satellite.
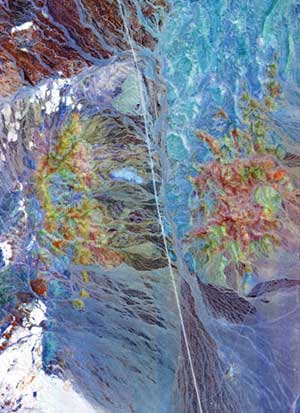
Images acquired at 8.93, 9.37 and 9.81 µm with a TASI-600 hyperspectral system help geologists map mineral resources over the Cuprite Hills in Nevada. Courtesy of ITRES Research Ltd.
As with any lab-based spectrometer, remote multispectral and hyperspectral imagers collect and analyze the spectral information from the target under its gaze. Spectral differences not only help differentiate between the leafy canopy of a dense forest and the algae in a nearby lake, but also between species of trees and other plants within that same forest.
How much data these specialized sensors can collect depends on the wavelength range to which they are sensitive. The difference between multispectral and hyperspectral imagers is nuanced, but, generally, both provide data from a multitude of wavelengths. Multispectral imagers, however, acquire imaging data only (and from discrete wavelengths to boot), while hyperspectral devices provide both imaging data and full spectra at each pixel as well as scanning within a range of wavelengths. For example, a multispectral imager may acquire an image of an ice floe at 600, 1200 and 3600 nm; a hyperspectral imager given the same task could look at every wavelength between 600 and 3600 nm.
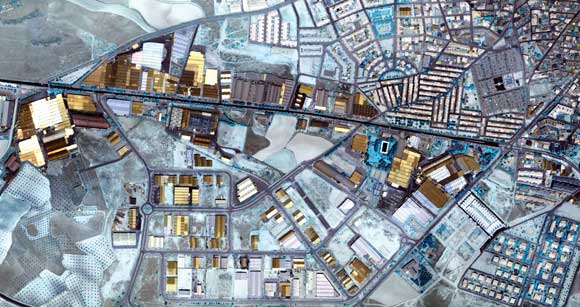
An overhead view of Villacañas, Spain, acquired in the short-wave infrared with the SASI-600 imager. Images in this band provide high-fidelity object classification, plant speciation and other vital data. Courtesy of ITRES.
“There is 20 years of spectral research to tap into, and it means a vast scope of environmental applications for monitoring various attributes in soil, water and vegetation,” said Petri Nygrén of Specim Spectral Imaging Ltd. in Oulu, Finland. He is in charge of the company’s AISA airborne imaging systems – hyperspectral systems that cover the visible, near-infrared, and short-wave and long-wave infrared regions.
The resolution offered by aircraft-mounted remote sensors varies not only with the device type, but also with flight speed. For example, the broadband imager TABI-1800 from ITRES Research Ltd. of Calgary, Alberta, Canada, offers a spatial resolution of about 15 cm at an airplane’s 150 to 200 knots, but about 2.5 cm at the more genial rate provided by helicopter transit.
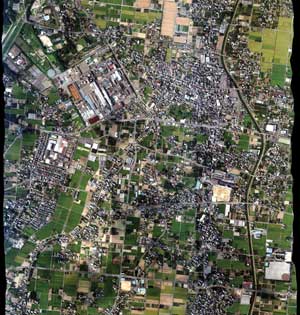
The ITRES Research Ltd. CASI-1500 captures images of cityscapes and other natural environments at 380 to 1050 nm,
with a resolution of 25 cm. Courtesy of ITRES.
The great forests of the world have always captured the imaginations of the populations that live around them. But it has been a while since people looked at them mainly as a source of wood and other resources, or even as a place to visit every once in a while to “commune with nature.” People still look at forests as a valuable resource, now without even having to cut them down.
The world’s forests together comprise one of the most controllable carbon banks available. Forests currently cover about one-third of the Earth’s land surface, and, according to NASA, as much as 45 percent of the carbon stored on land is held in these forested areas. Carbon released during wildfires or when trees are felled and converted into fuel adds to the carbon dioxide in the atmosphere, adding to the trapping of heat in the atmosphere.
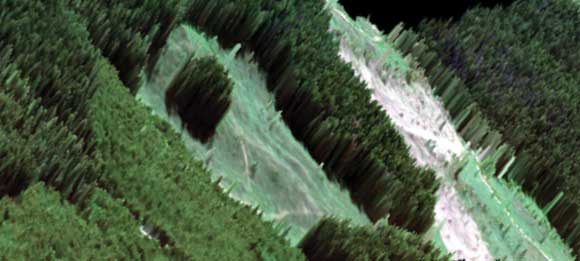
From an image combining hyperspectral and lidar data, vital information about the health of this forest in British Columbia can be gleaned. From this data, researchers determined a list of trees that included species, height, spectra and overall health. Courtesy of Specim Spectral Imaging Ltd.
Scientists at Woods Hole Research Center in Falmouth, Mass., and at more than a dozen other institutes are delving into the particular role that trees play in carbon banking, or sequestration. They want to know if today’s forests are holding as much carbon as they have in the past, and how they might be better maintained for future sequestration needs.
Using data from the lidar instrument on the Ice, Cloud and land Elevation Satellite (ICESat), the Moderate Resolution Imaging Spectroradiometer (MODIS), the QuikSCAT scatterometer, and the Shuttle Radar Topography Mission, researchers are mapping where the best carbon storage is taking place. They also are looking at data that will help preserve the health of the forests.
“Forest hygienics studies have the opportunity to assess the health of forests as a whole and particularly the spread of parasites or diseases,” said Specim’s Nygrén. (For information about ICESat-2, the next generation of the technology, read “Photonic Sensors Help Keep Earth Clean, Green” on p. 67.)
Orbiting sensors such as the Advanced Spaceborne Thermal Emission and Reflectance Radiometer, which is part of NASA’s Earth Observing System, are extremely useful to geologists as well as to foresters. Mineralogists and gas/oil specialists use data collected at short-wave infrared wavelengths and longer to identify sites worthy of exploiting.
Geologists have long used spectroscopic tools to analyze rock and soil samples carefully located and removed to field bases or brought home to university labs.
Freek D. van der Meer and his colleagues at the University of Twente in the Netherlands use both field and remotely gathered spectroscopic measurements to study hydrothermal systems – areas of volcanic land through which water and other fluids circulate, bringing about mineralogical changes. This passage of liquids leaches some minerals out of the rocks, but new minerals are formed and left behind as well.
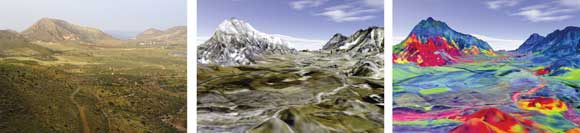
Left: Field photograph of the Los Tollos volcanic center near the town of Rodalquilar in Spain, which is an area of extensive hydrothermal alteration. Center: A natural color composite image shows the same site via data derived from the HyMAP airborne hyperspectral imager. Right: More data from the HyMAP imager shows hydrothermal alteration mineralogy of the area. The reddish colors are likely areas with gold mineralization. Red colors indicate intense alteration of the rocks and the presence of alteration minerals such as alunite and kaolinite. Green areas are related to alteration, but at lower temperatures and pressures, and are predominantly associated with the mineral illite. Blue areas are unaltered volcanic and sedimentary rocks. Pixel size of the HyMAP image is 4 x 4 m. Image maps produced by Frank van Ruitenbeek of the University of Twente. Data Credit: DLR of Germany.
Any remaining patterns of mineralization provide information about the fluid pathways through the system as well as the pressure and temperature conditions that have existed in the rocks. Studying fluid movement, temperature and pressure helps researchers to understand the underlying geologic processes and to predict where various bodies of specific ores are likely to occur. Such research also helps investigators understand and predict the geology of other planets, such as Mars.
Locating ores is not the sole purpose of remote imagers. Oil and gas engineers use multispectral or hyperspectral data to identify environmental risks at existing mining sites and oil fields, and soil scientists use the technology to map properties indicative of soil fertility and soil erosion, which can aid farmers and forest managers with their long-term planning.
Adrift in the Amazon
Tracing the metals, acids and other toxic materials that are the by-products of mining operations is important for the protection of globally and regionally important river systems. This is particularly true for the great rivers, such as the Amazon, which wander for hundreds of miles through both populated areas and highly inaccessible ones.
With its many tributaries and adjoining lakes, the Amazon has a wealth of water sources, some of them crossing through gold mines that dot the South American hills through which the river system flows. Gathering water samples by hand would be an impossibly tedious task and could not supply nearly large enough sample collections, so Felipe de Lucia Lobo and his colleagues at Instituto Nacional de Pesquisas Espaciais in São José dos Campos, Brazil, looked to the reflections off the Amazonian waters.
“Because the region is too large, we need tools that provide information about water quality in a large scale,” Lobo said.
Lobo, who now is pursuing the project from the University of Victoria in British Columbia, Canada, compiled reflectance data from several remote sources, including NASA’s Hyperion instrument and the European Space Agency’s MERIS (Medium Resolution Imaging Spectrometer). The former provides per-pixel resolution of 30 m, while the latter provides a resolution of 250 m. Data from these spectra were tested against those gathered from field tests using handheld spectroradiometers.
The data from the multispectral imagers proved that the Amazon’s waters contain variable – and detectable from afar – concentrations of optically active components (OACs). These OACs comprise such elements as phytoplankton pigments, inorganic suspended solids, dissolved carbon from decayed plants and animals, and water molecules themselves.
Lobo’s group sorted the OACs into several broad groups that help define the water sources from which they originated:
• Clear waters with low concentrations of OACS.
• “Black” waters rich in dissolved organic compounds.
• Waters with large concentrations of inorganic suspended solids.
• Waters dominated with chlorophyll from phytoplankton.
For these studies, Lobo said, field research using handheld spectroradiometers remains the best way to collect data – for now. He and his colleagues reported, however, that the remotely gathered reflectance data provided classification accuracy as high as 67 percent.
Lobo’s plan is to continue using remote-sensing and specialized geographical data analysis to monitor inland water quality.
“I want to provide key information that actually supports regional policies in order to improve water resources management and quality of life,” he said.
Technological evolution
Hyperspectral imaging technology has matured from the research labs and is rapidly finding its way into commercial applications, Specim’s Nygrén said. “The main problems the hyperspectral industry is now facing are related to creating an efficient work flow with easy-to-use analysis tools.”
The number of remote sensor users is growing, and these clients are looking for several things, according to Daren Trudeau of ITRES Research. They want better performance, more technical capability, smaller sizes, wider swatch coverage and simultaneous data collection across a wide spectral band, he said. They also want faster access to the data once it is collected.
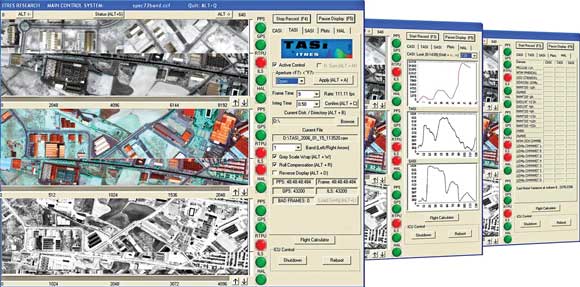
The MuSIC (Multiple Sensor Instrument Controller) system from ITRES Research Ltd. shows data from up to three sensors in a single real-time display. Courtesy of ITRES.
As with most technologies, improvements in one area may bring about reductions in another, a fact of which manufacturers of hyperspectral imaging systems are keenly aware.
“We’ve strived to produce imaging systems that are physically smaller with each succeeding generation,” Trudeau said. “Ultimately, though, shrinking the size of the system often incurs a performance penalty, which may be acceptable for some users.”
Likewise, Trudeau noted, imagers that cover ever-wider swaths of territory in a single pass reduce operational costs and allow for higher spatial resolution, but tend to be more expensive.
But there is more to hyperspectral imaging than merely spatial resolution, according to Nygrén. “Real applications with repeatability require high spectral resolution, spectral stability and sensor sensitivity. Having an instrument with those qualities does not come without a cost.”
“I am an application person more than a sensor person,” van der Meer said. “I think that we would greatly benefit from a hyperspectral mission in space, as it will provide access to data in any place in the world rather than being dependent on aircraft campaigns, which are costly and typically ‘one off’ experiments.”
Having said that, he added, there remains the trade-off between spatial resolution, global coverage and repeatability. “We need global coverage for data accessibility, we need repeated observations to allow monitoring and, hence, make the link to studying dynamic processes, and we need protocols and standards so that measurements are reproducible.”
Because 70 percent of the Earth’s surface is covered by oceans, van der Meer said, there is a lot of sea bottom that likely will have much great geology left to explore – which will be difficult even with advanced remote sensors. There are even areas uncovered by water where nearly vertical cliffs and overhanging areas likely will occlude use of remote sensors.
Future improvements in hyperspectral imaging may come from research into novel sensor materials or from new ways to sift through large amounts of data. But even as novel remote sensing applications continue to stack up, ongoing research will go only so far.
Improvements will come not only from scientific research, but also from unexpected sources, van der Meer said. “Breakthrough science is rarely planned.”