Jeff Hulett, Vektrex
The LM-85 approved method for electrical photometric measurement of high-power LEDs harmonizes the methods currently in use and addresses
measurement consistency issues. This is the first in a two-part series.
The standardized photometric testing methods in use today – Commission Internationale de l’Éclairage (CIE) 127 and Illuminating Engineering Society of North America (IESNA) LM-79 – were originally adapted from tests for incandescent and other electric lamps. In these methods, the lamp is powered continuously, and long stabilization times are mandated.
Though tedious, these methods worked well for early low-power LED devices targeting indicator applications, but the long stabilization times were frequently impractical in areas such as production LED testing. More powerful LEDs were also difficult to test because heating caused a significant LED temperature rise, altering the results. Many laboratories substituted ad hoc pulsed methods to speed testing, but often absolute accuracy was sacrificed, and method variations meant results from different laboratories did not agree.
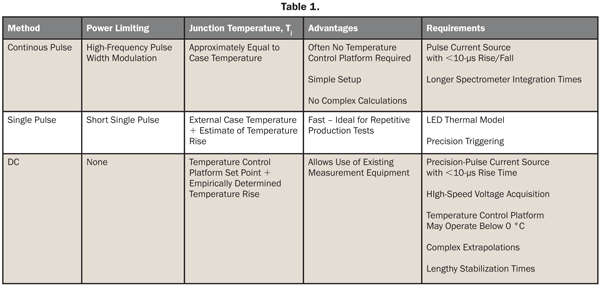
Developed by IESNA, the LM-85 method specifies three LED testing approaches that may be used to accurately measure high-power LEDs at a specified junction temperature:
1. Continuous pulse
2. Single pulse
3. Direct current (DC)
This article is the first of two discussing the LM-85 standard.
Each of LM-85’s three methods has unique advantages and requirements, as shown in Table 1.
Measurements and junction temperature
CIE 127 and LM-79 both specify an ambient temperature of 25 °C during photometric measurements. Both procedures assume that the LED is stable with respect to the ambient temperature during the measurement. LM-79 ensures this by specifying a 30-minute stabilization time. Though tested LEDs are stable, both CIE 127 and LM-79 methods leave the LED semiconductor junction temperature, Tj, in question.
Junction temperature is a key parameter for LED photometry. An LED’s efficiency decreases as its semiconductor junction temperature increases. This is due to temperature-dependent semiconductor properties such as nonradiative recombination and carrier loss. This efficiency drop can change the LED’s optical output dramatically – a typical white LED output may decline 20 percent for a 50 °C rise in junction temperature, as shown in Figure 1.
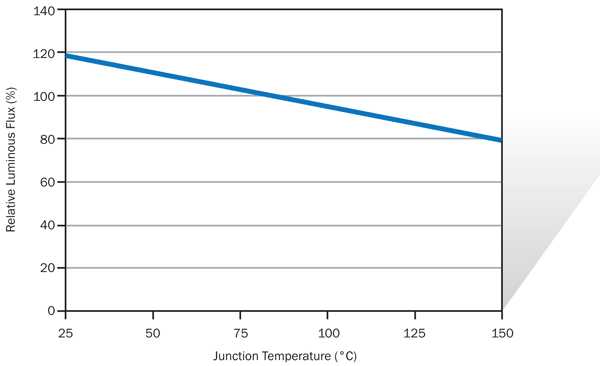
Figure 1. Typical white LED flux vs. Tj.
For low-power LEDs operating on the order of milliwatts, little heating occurs during an LM-79 measurement, and junction temperature is roughly equivalent to the ambient temperature. However, today’s high-power LEDs operate at much higher power levels, exceeding 100 W for some chip-on-board modules. These high-power devices undergo significant heating during a photometric test. Without temperature control, a typical LM-79 measurement results in a junction temperature of 100 °C or more above ambient. The same LED tested using an ad hoc pulsed method might see only a 10 °C rise; thus the variation in industry measurements.
LM-85 is the first testing method to tie photometric and electrical measurements to junction temperature. In fact, it allows junction temperature to be specified for the test, so a laboratory can choose 25 °C, the traditional ambient test temperature, or a different junction temperature that is more representative of the LED’s intended use. To control junction temperature, LM-85 allows the use of temperature control platforms (TCPs) – usually in the form of thermoelectric coolers. LM-85 also employs pulsed current to limit LED power.
Early in the drafting process, LM-85’s authors realized that a single test method would not suffice for the standard. In the end, two of the most popular ad hoc methods and one new method were included. All use some combination of power limiting and temperature control.
Continuous pulse: Simple and accurate
LM-85’s continuous pulse method relies on pulse width modulation of the current to limit the LED power. The LED is driven with a pulse current source at its nominal DC current, using a pulse width modulation duty cycle that is very low – typically 1 percent. At such a low duty cycle, the average power is very low, which simplifies temperature control.
Short, accurate pulses are essential for successful continuous-pulse measurements. LED heating becomes significant after the first 50 to 200 µs, so current pulses must be shorter than this range to limit peak LED heating. Rise and fall times should be less than 5 percent of the pulse width, or about 2.5 to 10 µs.
Figure 2 shows an oscilloscope capture of a typical current waveform, in this case a 35-W, 35-V LED being tested with 1-A, 100-µs pulses.
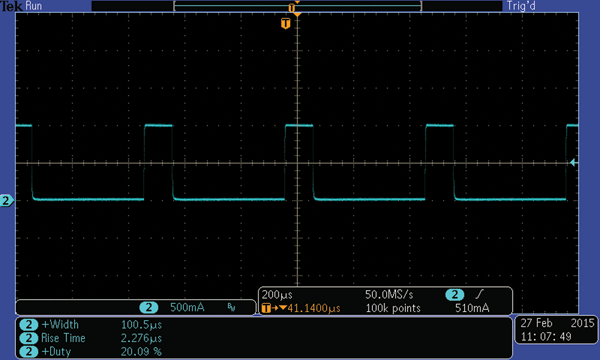
Figure 2. Continuous pulse current waveform; 35-V, 1-A LED array driven with Vektrex SpikeSafe 400 pulse current source, 20 percent duty cycle.
The LED junction temperature in this method is continually changing. The average value is close to the external case temperature, and peak excursions are small, so the referenced junction temperature is approximately equal to the external LED case temperature.
Because the junction has minimal heating, no stabilization time is needed prior to a measurement. However, spectrometer integration times must be lengthened by the reciprocal of the duty cycle for continuous-pulse measurements.
Continuous pulse is the simplest of the LM-85 methods. The methodology is straightforward stimulus/response with no complex calculations or adjustments. Usually LED heating is low enough so that a TCP is not needed. Together, these characteristics mean an existing LM-79 photometric system may be upgraded for LM-85 simply by replacing the DC current source with a suitable pulse current source.
Single pulse: Fast measurements
The single-pulse method limits LED power by powering the LED with a single current pulse, usually in the range of 50 to 300 ms. Such pulses are short enough to limit LED package heating but not short enough to limit junction heating. Often the LED’s junction temperature increases from 10 to 30 °C above the case temperature by the end of the pulse, as shown in Figure 3.
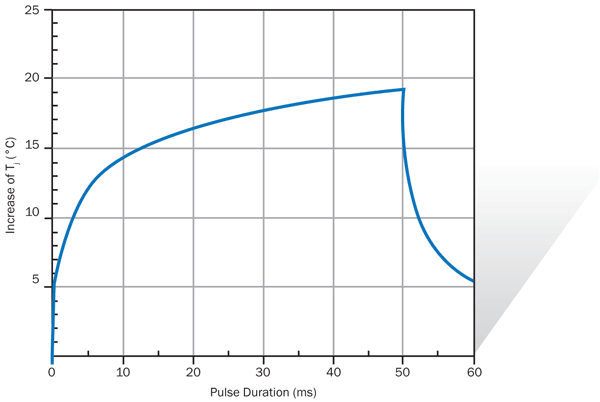
Figure 3. Typical single-pulse LED Tj rise.
Photometric measurements are made during the pulse, after the current waveform has settled, using a triggered spectrometer configured with an integration time shorter than the pulse duration. Precise triggering is essential for repeatable measurements. A small change in trigger point will result in a measurement at a different point in the LED heating curve. For best accuracy, both the pulse current source and the spectrometer should incorporate a precision digital trigger.
Single-pulse testing requires a pulse current source with high continuous power capability. Duty-cycle-limited modes that are found in some common source/measure instruments are not suitable.
Since the junction temperature rises significantly during the pulse, the junction temperature referenced in the single-pulse report is the sum of the case temperature and the estimated average temperature rise. LM-85 recommends that a thermal model be used for estimation.
Single pulse does not need a stabilization time, so measurements may be performed immediately after the electrical connection is complete – a nice feature for high-speed test applications such as production binning.
Single pulse is similar to the ad hoc industry pulse methods widely used for binning and characterization. LM-85’s version requires the measurement to be tied to a specific junction temperature, and this can be difficult if a thermal model is not available. The next article in this series discusses a way to accurately characterize the junction temperature rise without a thermal model.
DC: Direct current
The DC method does not limit the LED power. As with the LM-79 test method, LM-85’s DC test method uses direct current to power the LED; it is at full power during the measurement, and a lengthy stabilization time is needed. To maintain a stable junction temperature, the DC method employs a programmable TCP to remove excess waste heat. The TCP must be capable of handling the full LED power.
To establish the junction temperature, the DC method uses a temperature reference technique developed by Yuqin Zong and others at the National Institute of Standards and Technology (NIST). In this technique, the LED is first mounted on the TCP, then set to the desired junction temperature. The LED is then powered on with a current step, which must have a fast rise time, on the order of 2.5 to 10 µs, similar to continuous pulse. A set of high-speed voltage samples of the LED forward voltage, Vf, is then acquired as the LED warms up. Figure 4 shows a typical current pulse and Vf capture. This falling voltage trend is then graphed and extrapolated to obtain a theoretical forward voltage at the moment of turn-on, called Vf(0). This voltage represents the forward voltage of this LED when operating at a junction temperature equal to the TCP temperature.
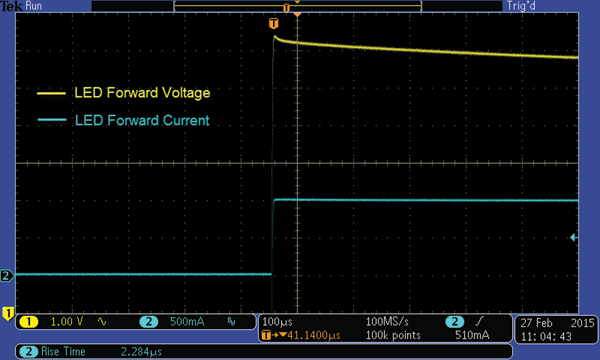
Figure 4. DC method current step and LED Vf; 35-V, 1-A LED array driven with Vektrex SpikeSafe 400 pulse current source.
Once Vf(0) is determined, the LED is again powered with DC, and the Vf is monitored. The TCP temperature is reduced until Vf equals Vf(0). At that point, the LED junction is at the desired temperature, and measurements may be made. This second step may be performed with the same testing apparatus, or a different one may be used.
While this two-step process may seem cumbersome, it is actually the DC method’s main advantage. It allows a laboratory to characterize an LED using a high-powered pulse current source, and then to make measurements using existing photometric measurement equipment employing DC current.
The DC method is the most complex of the three methods and can require long stabilization times to allow the LED to reach the desired temperature. In addition, for LEDs with a high thermal resistance, matching Vf(0) may require the TCP to operate below 0 °C. This drawback is discussed at greater length in the next article in this series, and a workaround is presented.
All three versatile photometric testing methods offered by LM-85 reduce measurement errors by associating measurements with the LED’s junction temperature. Each method allows junction temperature to be specified prior to the test. Lighting designers can now obtain photometric testing data at actual LED operating junction temperatures. Testing laboratories upgrading to LM-85 capability may implement all three or choose the method that best suits their situation.
Meet the author
Jeff Hulett is chief technology officer at Vektrex in San Diego; [email protected].