A newly developed Raman technique can identify chemical species nondestructively beneath diffusely scattering packaging material such as plastics or tablet coatings.
JUN ZHAO, KATHERINE A. BAKEEV AND JACK ZHOU, B&W TEK LLC.
Raman spectroscopy is a well-established molecular spectroscopic technique for noninvasive and nondestructive chemical analysis. It is used to identify mostly organic materials, such as carbon nanomaterials, controlled substances and hazardous chemicals, pharmaceutical raw materials, gemstones and minerals, pigments and paintings in art works1,2,3, and diseased tissue4. The instrumentation can be portable — even handheld — and equipped with software that, together with spectral libraries, gives an identification result in less than a minute. The portability of the instrument has increased the adoption of Raman spectroscopy as a screening tool for samples without the need to take them to a traditional laboratory environment5.
The sampling optics in conventional Raman instrumentation employ a focused design similar to confocal microscopes; for instance, both the excitation beam and the Raman signal beam are focused at the same spot. The sample is usually placed at this focal point. In this way, excitation power density and consequently the Raman signal radiance are maximized at the sampled volume, and only a signal from this tightly focused volume is collected. This confocal design has the advantage of maximum throughput and can be used to measure samples inside transparent containers in the same way a confocal microscope performs optical sectioning. The confocal approach loses its effectiveness when the container diffuses the light strongly because the light can no longer be focused onto the materials inside the container. The Raman signal for materials inside diffusely scattering containers is weak and is often accompanied by strong features from the container itself.
See-through Raman spectroscopy (STRaman), developed in 2016, expands the capability of Raman spectroscopy to measure samples beneath diffusely scattering packaging material. The system is designed to have a much larger sampling area than the confocal approach. This design enhances the relative intensity of the signal from the deeper layers, thereby increasing the effective sampling depth, and allows the measurement of material inside visually opaque containers. The larger sampling area has the added advantage of preventing sample damage by reducing the power density, as well as improving measurement accuracy by eliminating the variability detected when measuring with a small spot size on a heterogeneous sample. Additionally, the system can be easily adapted to a confocal configuration, allowing standoff, contact or microscopy analysis.
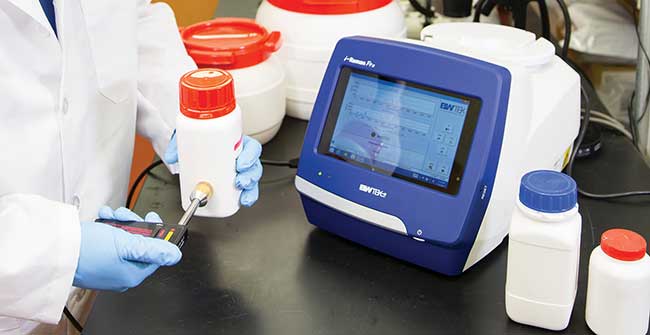
STRaman spectroscopy has similar capabilities to spatially offset Raman spectroscopy (SORS)6. SORS operates by intentionally offsetting the excitation and collection beams, and can also effectively collect Raman signals generated underneath diffusive top layers while largely avoiding their signature from overwhelming that of the sample. However, probes of SORS design cannot be easily used in a confocal arrangement and are generally inefficient for direct sample measurements. The following are illustrations of the benefits of this new Raman technique. All spectra can be acquired on an i-Raman Pro ST spectrometer from B&W Tek, equipped with a 450-mW, 785-nm laser; the intensity axis is corrected using SRM 2241, following procedures developed at the National Institute of Standards and Technology7.
Penetrating plastic
Many solid chemicals are delivered in white plastic containers, often made of titanium dioxide-filled polyethylene. The filler material scatters light and makes the plastic appear opaque. Laser light cannot be focused inside such containers due to the strong scattering, precluding the use of conventional Raman backscatter measurement designs. Using STRaman, both the 785-nm excitation laser and the Raman scattered light can penetrate the plastic wall through a diffuse scattering mechanism, and its large effective sampling depth allows such materials to be interrogated and identified.
The identification of sodium benzoate in a white plastic bottle was made using STRaman. In this configuration, the measured Raman spectrum shows the very strong contribution of the sodium benzoate that is evident on top of the container signature (Figure 1a), while the spectrum acquired using a traditiona1 Raman configuration is dominated by the container material, with only a small contribution of the content material (Figure 1b). Subtracting properly scaled (b) from (a) results in Figure 1c, which is in close agreement with the spectrum of pure sodium benzoate (Figure 1d).
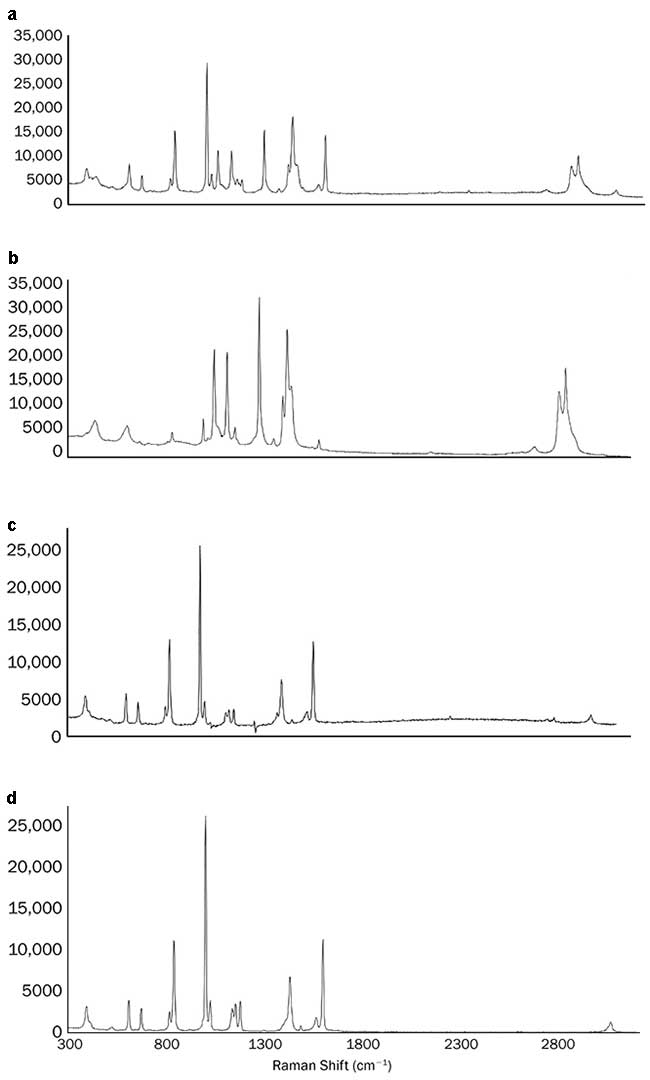
Figure 1. See-through Raman spectroscopy (STRaman) identification of sodium benzoate through a white polyethylene bottle; spectrum measured through the bottle using the STRaman technology (a); spectrum measured with a standard Raman configuration (b); the result of scaled subtraction of b from a (c); pure spectrum of sodium benzoate (d). Courtesy of B&W Tek LLC.
Specialized library searching software has been developed using a proprietary algorithm to isolate the content signature from the container and is capable of identifying even very weak Raman scatterers such as metal oxides inside strong scattering package material. The technology increases the capability for pharmaceutical and chemical manufacturers to do incoming material inspection of their raw material with minimal sample handling. The identification is done quickly, with the result typically presented on the screen in seconds. This same identification can be done on intermediate products that may be moved from one manufacturing site to another for processing as well as for final packaged products, to verify their identity.
Identification through envelopes
Unknown samples are encountered by the postal service, customs, border patrol and law enforcement in envelopes and packages. For initial screening, identifying the contents without opening the package is preferred, thus minimizing exposure and package tampering. Paper is made of mostly cellulose fibers that strongly scatter light. Raman spectra of paper products such as manila envelopes are often accompanied by strong fluorescence that contributes a strong background, often overwhelming the Raman spectrum. Using the STRaman technology, D−(+) glucose is readily identified when measured through a manila envelope (Figure 2a); the resulting spectrum is shown in Figure 2b. With a regular confocal Raman configuration, only the signature of cellulose is observable on top of a fluorescence background (Figure 2c). The increased sampling depth of the new technology allows identification through the envelope in cases where the paper allows the excitation laser and the Raman scattered signal to pass through. This provides a noninvasive screening method for package inspections, allowing for rapid detection of substances that may pose a threat to the recipient or package handler.
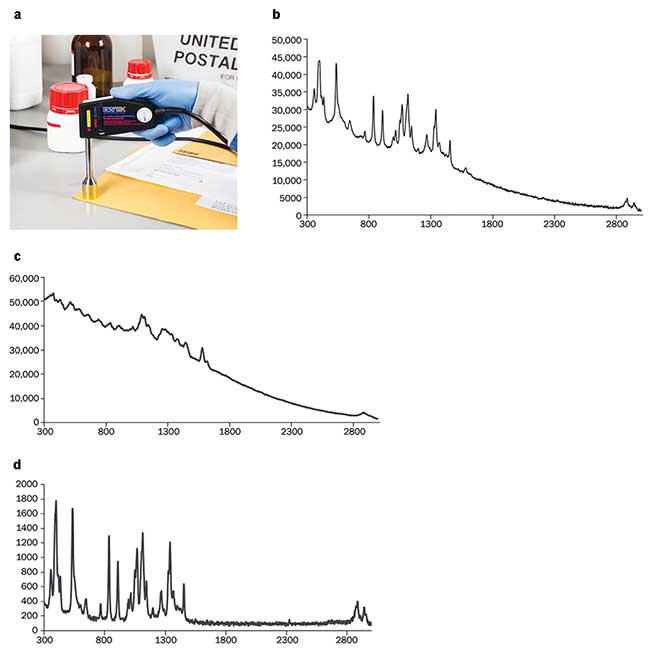
Figure 2. STRaman identification of D−(+) glucose through a manila envelope (a); spectrum measured through the envelope using the STRaman technology (b); spectrum measured in envelope with a standard Raman configuration (c); spectrum of D−(+) glucose measured directly with a standard Raman configuration (no packaging materials)(d). Courtesy of B&W Tek LLC.
Measuring through tablet coatings
Many oral medications in the form of tablets are coated with sucrose, TiO2 and colorants to mask flavor, to make them easier to swallow or to control the release of the medication. The coating layer makes it difficult to measure the drug using traditional Raman methods that do not have a deep penetration depth; identification of the active ingredients often requires breaking the tablet or scraping off the coating layer. A drug’s Raman signature is almost completely masked by the coating (Figure 3b; the peaks between 600 and 1400 cm-1 are signatures of sucrose, which is part of the coating). Using the STRaman technology, however, the Raman signature from the drug dominates (Figure 3a), with arrows marking peaks from the active ingredient ibuprofen, comparable to the Raman spectrum of the pure drug (Figure 3c).
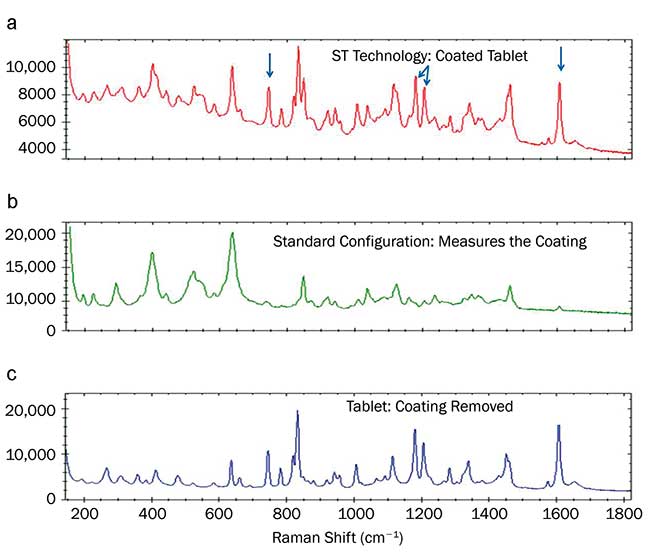
Figure 3. Raman spectra of coated tablets. Coated tablet spectrum measured using the STRaman technology (a); coated tablet spectrum measured with a conventional confocal Raman configuration (b); spectrum of the tablet with the coating stripped, measured with the conventional confocal configuration (c). Courtesy of B&W Tek LLC.
Dark material absorbs light and can be a challenge to analyze with Raman without damaging the sample. With the design of the STRaman, laser power is distributed over a larger sampling area, thereby avoiding sample damage. This expands the capability of Raman to measuring sensitive samples such as photolabile or thermolabile material, biological tissues, historical artworks or archaeological materials. Energetic materials such as gunpowder must be carefully handled and measured in very small quantities with conventional Raman because of the ignition potential with the focused energy of the laser excitation. The decreased power density of the STRaman design allows for the collection of gunpowder spectrum at high laser power. Raman peaks of the gunpowder component sulfur at 217.6 cm-1 and 471.5 cm-1, and nitrate at 1049.3 cm-1, are easily identified.
The deep penetration and low power density as a result of the large sampling area make STRaman suitable for examining mammal tissue in vivo. The phosphate signature is prominent in the tibia spectrum measured with STRaman, but absent in the leg tissue. Other differences between the tibia and muscle include stronger peaks in the tissue spectrum arising from the amide III, the CH2 wagging, the amide I8 and the C=O stretching bands9.
Larger sampling area
Representative sampling of heterogeneous material to obtain bulk properties can be difficult for Raman spectroscopy, which typically has a sampling area of no more than 100 µm in diameter. When the ingredients are not well mixed on a scale smaller than the sampling area, collection of spectra at different points on the sample can produce widely varying results. This requires many measurements to be made and averaged for representative results. A larger sampling area is needed to get more consistent measurements of typical products with multiple components.
The difference in results from conventional Raman systems with a spot size of about 100 µm vs. the larger sampling area of several mm with the STRaman probe can be seen in the spectra of a tablet of an over-the-counter pharmaceutical analgesic containing three active ingredients. Fifteen spectra (baseline-subtracted and intensity normalized) were collected over randomly chosen positions using a confocal fiber probe, which has a sampling area of roughly 0.3 mm in diameter. The signatures of the three active ingredients — acetaminophen, aspirin and caffeine — can be detected in all the spectra, though their relative intensities vary greatly, reflecting the sample heterogeneity. This makes it hard to reliably identify the product. This can be demonstrated by taking a number of such spectra, computing their average and using it to represent the product in a spectral library. For each measurement, we search the library and obtain a hit quality index (HQI) against the reference spectrum and get a distribution of results reflecting the sample heterogeneity at this small scale. The HQI is a measure of similarity based on the cross-correlation of a measured spectrum to a library spectrum, with a higher value indicating greater similarity. Using a passing threshold of 95, 18 of the sample spectra result in false negatives. The average and standard deviation of the 43 HQI values are 93.4 and 6.1, respectively.
By measuring the same samples with the STRaman configuration, which has a 4-mm diameter sampling area, the reproducibility of the spectrum, and therefore the identification, are greatly improved, with no false negative results in the 17 measurements (schematics depicting results are available on photonics.com).
Pure samples of large crystalline form can also present problems when measured with a small sampling area. Due to Raman’s polarization effect, the spectrum of a crystalline sample generally appears different as its orientation varies relative to the direction and polarization of the excitation and collection beams. When measuring a bag of xylitol over randomly chosen locations using a standard configuration and spot size on the order of 100 µm, the relative intensity of the Raman peaks vary so much that the spectra can easily be mistaken as being of different materials. In using a spectral library for identification with a passing HQI threshold of 95, the researchers obtained three false negatives of the 21 measurements made. The average and standard deviation of the 21 HQI values are 97.6 and 2.7, respectively. Using the STRaman configuration, 27 measurements of the same sample were made, with the average and standard deviation of the HQI values at 99.98 and 0.011, respectively. With the larger sampling area of this configuration, the reproducibility is greatly improved, and the rate of false negatives is reduced to zero.
Versatility with sampling kits
The aforementioned examples illustrate the benefits and unique features of STRaman. The STRaman system design has the versatility to be used for conventional Raman measurements by making use of a variety of sampling accessories that address specific application needs and take advantage of the same high-performance hardware and software platform (Figure 4).
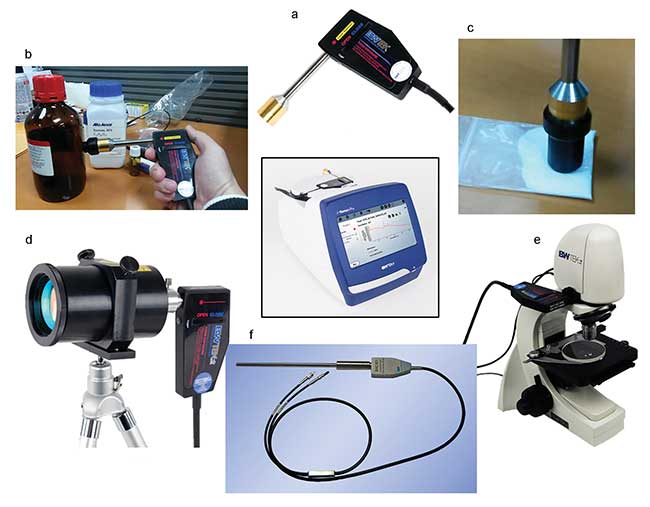
Figure 4. STRaman technology has the versatility to be used with a range of sample accessories to address different sampling needs. The standard STRaman fiber probe has a 4-mm diameter spot size (a). For measurement of liquids in glass bottles, the probe can be converted to the confocal configuration by adding the focus adaptor (b). Focusing on the sample deep inside the glass container maximizes the Raman signal while minimizing the fluorescence interference due to the glass. Adding a surface regulator on top of the focus adaptor (c) brings the focal point to the surface, making it easy to do everyday measurements of samples exposed or inside thin transparent packaging material. Replacing the STRaman probe shaft with a telescope lens allows for standoff Raman measurements (d). The same probe mounted on a microscope allows for Raman microscopy (e). Replacing the entire STRaman probe with an industrial grade probe (f) turns the instrument into a process analytical technology tool. Courtesy of B&W Tek LLC.
STRaman technology allows for the examination and identification of chemical species covered by diffusely scattering media noninvasively and nondestructively. Its large sampling area improves measurement reproducibility for heterogeneous and crystalline samples including solid powder blends. The reduced power density allows measurement of photolabile or thermolabile samples that may suffer damage with conventional Raman techniques. These characteristics and the system’s versatility greatly expand the utility of Raman spectroscopy for field and research applications.
Meet the authors
Katherine A. Bakeev, Ph.D., is director of market and customer development at B&W Tek LLC. She often presents on mobile spectroscopy solutions; email: [email protected].
Jun Zhao, Ph.D., is director of technology at B&W Tek LLC. He has more than 50 publications, patents and conference presentations related to Raman spectroscopy; email: [email protected].
Jack Zhou, Ph.D., is COO of B&W Tek LLC and responsible for product development and commercialization. He received his M.S. and Ph.D. in analytical chemistry from the University of Connecticut. He has authored more than 30 scientific publications and holds several U.S. and international patents in the areas of optical instruments, lasers and spectroscopic devices; email: [email protected].
References
1. I.R. Lewis and H.G.M. Edwards, eds. (2001). Handbook of Raman Spectroscopy, Practical Spectroscopy Series 28. New York: Marcel Dekker.
2. J.M. Chalmers et al., eds. (2012). Infrared and Raman Spectroscopy in Forensic Science. Chichester, England: John Wiley and Sons.
3. R. McCreery et al. (1998). Noninvasive identification of materials inside USP vials with Raman spectroscopy and a Raman spectral library. J Pharm Sci, Vol. 87, Issue 1, pp. 1-8.
4. K. Kong et al. (2015). Raman spectroscopy for medical diagnostics — From in-vitro biofluid assays to in-vivo cancer detection. Adv Drug Deliv Rev, Vol. 89, pp. 121-134.
5. M.D. Hargreaves (2014). Handheld Raman spectrometers and their applications. In Encyclopedia of Analytical Chemistry. Chichester, England: John Wiley and Sons. DOI: 10.1002/9780470027318.a9378.
6. P. Matousek et al. (2005). Subsurface probing in diffusely scattering media using spatially offset Raman spectroscopy. Appl Spectrosc, Vol. 59, pp. 393-400.
7. S.J. Choquette et al. (2007). Relative intensity correction of Raman spectrometers: NIST SRMs 2241 through 2243 for 785 nm, 532 nm, and 488 nm/514.5 nm excitation. Appl Spectrosc, Vol. 61, Issue 2, pp. 117-129.
8. P. Matousek et al. (2006). Noninvasive Raman spectroscopy of human tissue in vivo. Appl Spectrosc, Vol. 60, pp. 758-763.
9. X.-F. Ling et al. (2002). Investigation of normal and malignant tissue samples from the human stomach using Fourier transform Raman spectroscopy. Appl Spectrosc, Vol. 56, pp. 570-573.