LEDs hold great promise for controlled-environment agriculture. Developing the right strategy requires the means to establish the optimal wavelengths and spectral ratios.
TESSA POCOCK, RENSSELAER POLYTECHNIC INSTITUTE
Urban and periurban agriculture is rapidly becoming part of local economies. It is supported by increased consumer demand and preference for high-quality, locally produced foods. Socially, it is reacquainting people with food and the farm, and it is creating jobs across the entire supply chain.
Controlled-environment agriculture (CEA) is an intensive form of agriculture that has recently taken on different forms, including rooftop greenhouses, retrofitted warehouses, shipping containers, and growth chambers. CEA is resource-intensive and is most suited for the production of high-value crops, such as perishable foods, herbs and spices, ornamentals, and medicinal compounds.
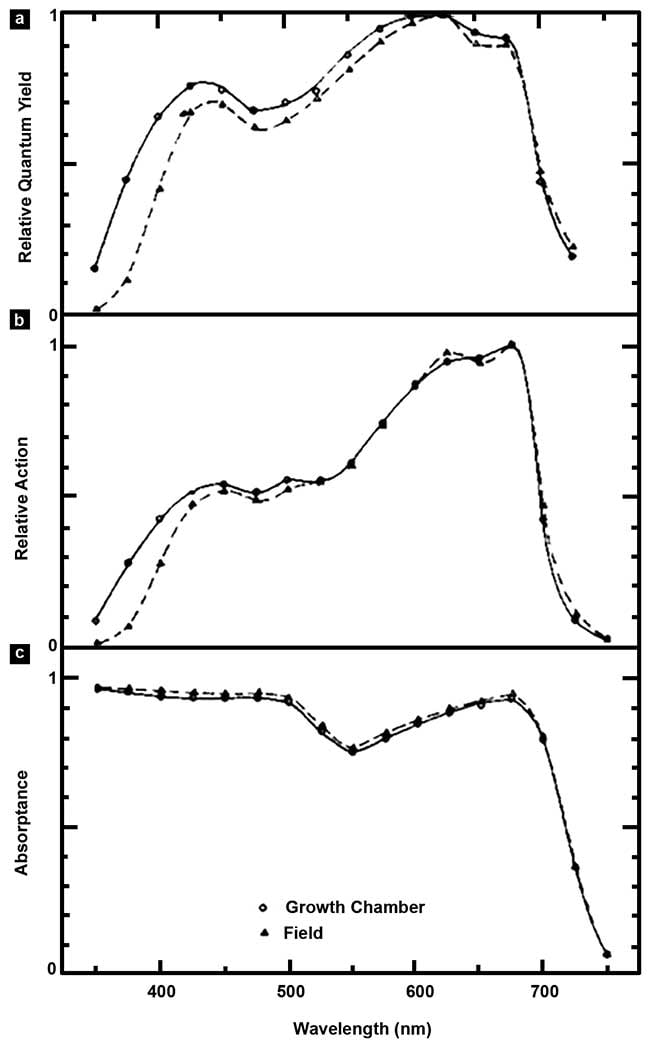
The McCree curves. The relative quantum yields (Φ) (a), relative action (b), and absorptance (c) spectra for the 22 crop species grown in the field and growth chambers. Adapted from reference 4.
In contrast to the field, CEA offers consistency of crop supply through automated and mechanized control systems that regulate temperature, relative humidity, CO2, shade, air exchange, and light to satisfy individual crop requirements.
Light is an absolute requirement for plant growth, and it is the least controlled and most expensive environmental parameter because of legacy technology. To date, light automation in greenhouses involves sensing the instantaneous photo-synthetically active radiation (PAR) or daily light integrals (DLI). Then supplemental high-intensity discharge (HID) lamps are turned on or off to meet required crop light levels. The lamps typically are high-pressure sodium (HPS) or metal halide (MH). Warmup times are long (~20 min), lamp lifetimes are short (~10,000 h), and the spectrum cannot be adjusted.
According to a 2017 U.S. Department of Energy report, LEDs make up just 2 to 4 percent of the lighting technology mix for U.S. supplemental CEA lighting1. The challenges for the adoption of solid-state lighting into the CEA industry include high capital and operating costs, and the lack of science-based evidence and knowledge of how to blend and use the varied spectra for optimal crop production.
But there are many benefits to using LEDs in CEA.
In contrast to HID lighting, LEDs have rapid warmup times (sec-min) and long lifetimes (~50,000 h). In addition, both photon flux density (PFD) and the spectra are readily adjustable.
LEDs offer myriad horticulturally relevant spectral combinations and, together with the ability to alter spectra quickly and dynamically, provide countless opportunities to control the production of horticultural crops. Plants require orders of magnitude more light than that used in human applications, and many plant species are responsive to the spectral distribution. This responsiveness is known as phenotypic plasticity and is dependent on the evolutionary history and growth conditions of individual crop species.
Using present-day HID lighting, growers select specific spectra, PAR, and DLI values for individual crops and their developmental stages. Cool white fluorescent (CWF) is used for low-light propagation and vegetative growth. MH lighting promotes strong vegetative growth and branching in crops that have high light requirements. HPS lighting has a positive far-red light effect on flowering, and its radiant heat works for crops or developmental stages that thrive at higher temperatures, especially during the colder months.
LEDs can mimic this function because spectra can be finely tuned and modulated. This can have beneficial effects on yields, nutritional and pharmaceutical value, and, thus, profitability.
At the fundamental level, much is known about the effects of spectrum on the growth and biochemistry of plants2. Each study uses different spectral distributions, PAR values, temperatures, CO2 concentrations, growth media, fertilizer programs, and crops.
Therefore, it is difficult to define a unified theory for the optimal selection of horticultural LED wavelengths. The PAR values for different crops are well-established, but the best spectral distributions are lesser known and depend on crop physiological, morphological, and biochemical architecture3.
The McCree curve has been used to provide a means to establish the optimal wavelength selections and spectral ratios for different crops. However, it is often misinterpreted and is often misrepresented in internet resources. What does the McCree curve tell us? And is this the right strategy to use when engineering horticultural LED systems?
Keith J. McCree was a professor of soil and crop sciences at Texas A&M University and held a Ph.D. in physics from Imperial College, London. During the early 1970s, he published several seminal articles on the absorptance and photosynthesis for 22 different crop plants grown in the field and growth chambers. From this, he validated the spectral range of 400 to 700 nm as an acceptable definition for PAR4. McCree measured three physiological parameters, including the quantum yield (Φ) of photosynthesis, action, and absorptance.
Also known as quantum efficiency, Φ is defined as the amount of O2 evolved or CO2 assimilated per quantum absorbed, in the absence of photorespiration5.
Physiologically, it describes the maximum photosynthetic efficiency with which light can be converted into chemical energy at low light. It is calculated as the initial slope of the linear portion of the curve that relates photosynthetic rate and photon flux density (PFD) using IR gas analysis techniques.
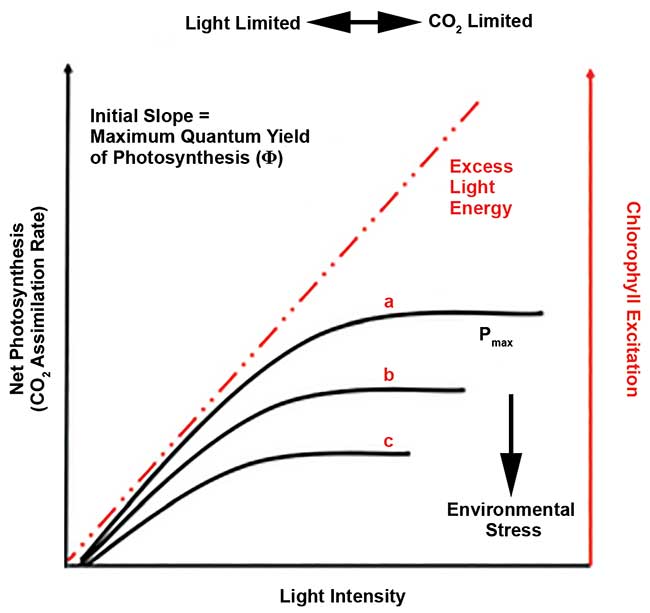
Photosynthetic light response curves performed under favorable conditions (a) and increasingly stressful growth conditions (b, c). Both the maximum quantum yield (Φ) and the maximum photosynthetic capacity (Pmax) are negatively affected by environmental stresses, light being one of them. Light is excessive to photosynthesis if the intensity (photon flux density) is above the light-response curves. Adapted from reference 11.
Light-response curves are defined as rectangular hyperbolas with the linear portion occurring at PAR values below approximately 20 to 60 µmol m2 s1. The saturated photosynthetic rate represents the maximum photosynthetic capacity (Pmax) and can occur well above 600 µmol m2 s1 for high-light crops. In addition to the growth history of the plant, unfavorable environmental conditions (e.g., high light, unbalanced spectra, low temperature, low CO2, low nutrient availability, etc.) can have negative impacts on both the efficiencies and maximum capacities of photosynthesis.
For instance, an imbalance in the red (600 to 700 nm) and far red (>700 nm) regions of the spectrum can reduce Φ because the two different photosystems (PSII and PSI) absorb differentially across the spectrum. PSII absorbs light <680 nm while PSI preferentially absorbs at ≥700 nanometers6. To maintain energy flow and thus efficiency, a broad spectrum is required, and red and far-red PFDs must be balanced to maintain photostasis7.
Interestingly, McCree did not calculate Φ as the initial slope of light-response curves, as was typically done. Based on the assumptions that photosynthetic light-response curves are described as rectangular hyperbolas and that Φ was wavelength-independent, he predicted that Φ could be estimated by a single-point measurement of the photosynthetic rate at low PFDs4.
McCree found that there was no irradiance effect on the relative spectral Φs and therefore measured the spectral effects on photosynthesis by adjusting the light source while keeping the photosynthetic rates constant. The constant photosynthetic rates were between 1 and 6 µmol CO2-assimilated sec−1 m−2, requiring between 16 and 150 μmol m−2 s−1 (3 to 27 W m−2) of light depending on the spectral region4. The highest Φs occurred in the red region (600 to 700 nm), while Φs in the blue (400 to 500 nm) and green (500 to 600 nm) regions were approximately 20 percent lower, with a further 20 percent dip between 470 and 500 nm. Field-grown crops had higher relative Φs compared to those grown in a growth chamber in the green and blue spectral regions, which is most likely because of leaf acclimation to the fluctuating and high-light outdoor environment.
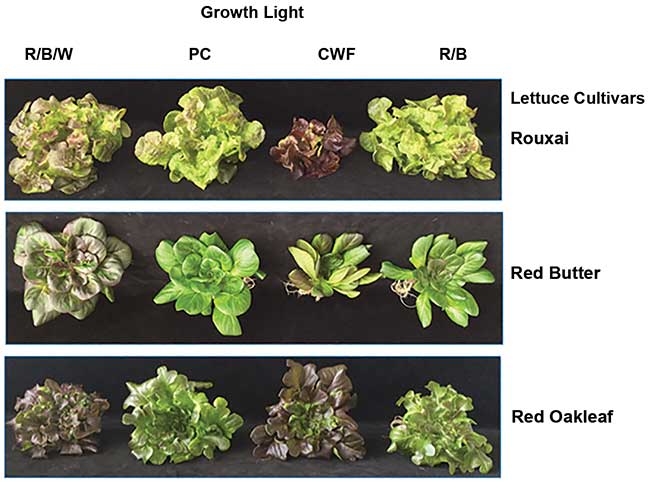
Spectral effects on size, form, and red pigmentation in red lettuce. Three different red lettuce cultivars (rouxai, red butter, and red oakleaf) grown under horticultural LEDs and cool white fluorescent (CWF) luminaires. The LED luminaires consisted of red, blue, and white LEDs, only-phosphor-converted white LEDs, and red and blue LEDs. Seeds obtained from Johnny’s Select Seeds. Photosynthetically active radiation (PAR) was 180 to 220 μmol m−2 s−1, with all other environmental parameters identical. Courtesy of Tessa Pocock.
The McCree curve has been repeated by others using the initial slopes of light-response curves. Although there was some variation in quantum yield, most data agreed and validated his single-point measurements5,8.
Depending on the wavelength, PAR values of the photosynthetic light used in these experiments were up to 50× lower than the optimal PAR for high-light crops, and the action was kept much lower than is required for good growth. Therefore, using the relative Φs as a model for LED selection is not ideal.
The Φs that McCree reported were single photosynthetic rates (action) that were adjusted for leaf absorptance at each of the wavelengths tested. The relative action measured by McCree was the CO2 assimilation rates based on ambient light energy (W m−2) emitted from the light sources4.
The relative action data for field and chamber studies are distinct from the relative Φs in that blue (400 to 500 nm) and green (500 to 600 nm) light regions had similar photosynthetic rates and were approximately 50 percent lower than the action under red light. This is the curve that should be used if spectral distributions are selected to fit the McCree curve. In fact, the McCree action spectral ratios are closely aligned to what has been observed as reasonable for many leafy green crops.
Last, leaf absorptance was measured in an integrating sphere housed with the same light source and monochromater used for leaf photosynthetic measurements. The absorptance was highest in the blue region (400 to 500 nm), with a 20 percent dip at approximately 550 nm. It is important to note that where the LED narrow bands lie within the distinct spectral regions has an effect, and this requires further investigation6,9.
The McCree curve describes the quantum efficiency of photosynthesis at different wavelengths at low light. The action spectrum describes actual photosynthetic rates and thus is the curve on which to base spectral selections. However, it is still largely unknown how the McCree curve translates to yield, appearance, desired development (e.g., flowering), good nutritional composition, and high levels of extractable products (e.g., aromatics, oils, pharmaceuticals) for a wide variety of crops and light sources.
In addition, it is difficult, if not impossible, to separate the effect of spectrum on photosynthesis and crop yield from the simultaneous spectral photomorphological effects on plants. Photomorphogenesis is the light-mediated development of plants, and the five different photoreceptor families in plants absorb and operate from 280 to 750 nanometers10. They control dozens of developmental processes, such as flowering, branching, height, leaf size, pigment concentrations, immunity, and defense, among others2.
Drawing on earlier light-quality research, the McCree curve included, is a good place to start when selecting LED combinations for individual CEA applications. However, more fundamental research will speed up lighting technological advancements and accelerate the adoption of LED systems in the CEA industry. Although in its infancy, it is clear that solid-state lighting fits well into the goals and definition of CEA.
Meet the author
Tessa Pocock, Ph.D., is a senior research scientist at the Center for Lighting Enabled Systems and Applications (LESA) at Rensselaer Polytechnic Institute (RPI) in Troy, N.Y. Prior to joining RPI in 2014, she spent almost a decade in the European horticultural lighting industry. Her research includes spectrum optimization and the development of biofeedback control systems; email: [email protected].
Acknowledgments
The author acknowledges and thanks the Engineering Research Centers Program (ERC) of the National Science Foundation under NSF Cooperative Agreement No. EEC-0812056 and the New York State Research and Development Authority (NYSERDA) Greenhouse Lighting and Systems Application (GLASE) Agreement No. 107303 for their support.
References
1. K. Stober et al. (2017). Energy savings potential of SSL in horticultural applications. Prepared for the U.S. Department of Energy Solid-State Lighting Program by Navigant Consulting Inc.
2. T. Pocock (2015). Light-emitting diodes and the modulation of specialty crops: light sensing and signalling networks in plants. HortScience, Vol. 50, pp. 1281-1284.
3. J. Nau (2011). Ball Redbook: Crop Production. Chicago: Ball Publishing.
4. K.J. McCree (1972). The action spectrum, absorptance and quantum yield of photo-synthesis in crop plants. Agric Meteorol, Vol. 9, pp. 191-216.
5. J.R. Evans (1987). The dependence of quantum yield on wavelength and growth irradiance. Aust J Plant Physiol, Vol. 14,
pp. 69-79.
6. T. Pocock (2016). Advanced lighting technology in controlled environment agriculture. Lighting Research and Technology, Vol. 48, Issue 1, pp. 83-94; doi:10.1177/1477153515622681.
7. H.P.A. Hüner et al. (2012). Chloroplast redox imbalance governs phenotypic plasticity: the “grand design of photosynthesis” revisited. Front Plant Sci, Vol. 3, article 255; doi:10.3389/fpls.2012.00255.
8. S.W. Hogewoning et al. (2012). Photosynthetic quantum yield dynamics: from photosystems to leaves. Plant Cell, Vol. 24, pp. 1921-1935.
9. M. Johkan et al. (2012). Effect of green light wavelength and intensity on photomorphogenesis and photosynthesis in Lactuca sativa. Environ Exp Bot, Vol. 75, pp. 128-133.
10. T. Pocock (2017). Influence of light-emitting diodes (LEDs) on light sensing and signaling networks in plants. In Light Emitting Diodes (LEDs) in Agriculture, edited by D. Gupta, pp. 37-58. Berlin: Springer.
11. E.H. Murchie et al. (2015). Photoprotection as a trait for rice yield improvement: status and prospects. Rice, Vol. 8, Issue 31; doi:10.1186/s12284-015-0065-2.
McCree Curve Takeaways
• Absorptance was high across the photosynthetically active radiation (PAR) spectrum (400 to 700 nm).
• The photosynthetic Φs and action are representative of low-light conditions only.
• Relative Φ is the photosynthetic response adjusted for absorbed quanta at each wavelength and is ideal for spectrum selection.
• Relative action is the photosynthetic response to light energy rather than quanta and is most suitable as a model for spectrum selection.
• All regions of the PAR spectrum drive photosynthesis, and the relative action shows that blue and green light contribute equally, with red light contributing the most.