To deliver high throughput and accuracy, flow cytometers need lasers with superior beam quality and high-performance optical components.
PATRICK SASSO, EDMUND OPTICS INC., AND DAN CALLEN, COHERENT INC.
Flow cytometry explores, analyzes, counts, and sorts small particles. With the increasing demands for higher data quality from researchers, clinicians, and manufacturers, component builders for these systems are being driven to increase the signal-to-noise ratio (SNR), rather than just the signal. SNR is a widely applicable engineering term referring to the relative size of the real signal (or signal variations) compared to random errors (noise) in the observed signal.
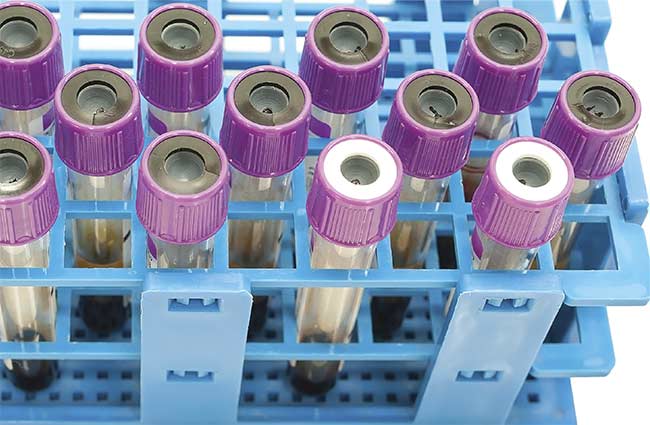
Blood sample tubes after analysis. Courtesy of iStock.com/chfonk.
On a low-quality video, for example, poor SNR may make it impossible to read small text, because the characters (signal) are obscured by random intensity variations (noise). Similarly, it’s easy to see a clear outside view through a dusty automobile windshield — the signal — until sunlight hits the window and causes a hazy glare, that is, high noise.
When discussing flow cytometry, specifically, it is important to examine how the performance of key optical components — including lasers, filters, and lenses — have a critical impact on overall SNR.
Flow cytometry is widely used in immunology and clinical testing, where blood cells are pretreated with several fluorescent markers, called fluorochromes, that are engineered to attach to various surface antigens on the blood cells. Inside the instrument, the cells are forced, through a process called hydrodynamic focusing, to flow in single file through an interaction zone where they are irradiated by focused laser beams at several wavelengths. Several photodetectors measure both the scatter and fluorescence as quantitative signals, after the fluorescence is separated into various wavelength bins, arranged in intervals, by optical filters.
Data quality, resolution
Data from flow cytometers is often displayed in two-dimensional graphs, where the quantitative signal from one wavelength channel is plotted against that from another wavelength, and/or a (side or forward) scattered light channel, for each cell or particle that passes through the interaction zone. All the events, or readings, corresponding to a single cell type produce a cloud of data points rather than a single data point, even for nominally identical reference latex beads.
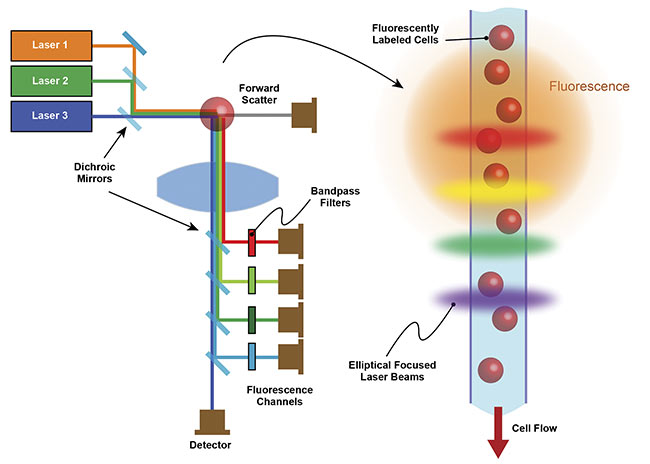
A schematic showing the main elements of a multiparameter flow cytometer. Courtesy of Coherent.
The reason for this presentation of data is the existence of random measurement noise resulting from natural variations both in the cells themselves and in the detection method. The former includes variations in the cell dimensions, as well as variations in how much fluorochrome is attached to the cell. The latter includes variations in the lateral position and orientation of the cells in the hydrodynamically focused flow stream.
All of these variations contribute to the spread of data points, the coefficient of variation, or rCV. In a high-performance instrument designed to measure multiple subsets of blood cell types, it is very important to minimize rCV so that the dot plots can be clearly delineated with minimum overlap. Higher SNR means a larger fuzzy cloud in the readout, and noise caused by the laser or the optics should not increase the size of these dot plots. However, overspecification beyond this point can unnecessarily increase instrument costs.
Laser criteria affecting SNR
Beyond the basic specifications of wavelength and power, several parameters quantitatively define the output quality of laser beams and directly affect SNR in flow cytometry applications.
Output power stability. The output power stability refers to time-dependent variations in the laser output power. This is usually defined by two noise values: peak to peak and root mean square (rms). The peak to peak shows the size of any sudden spikes or dips, whereas rms is a better overall representation of the average variations.
For a flow cytometer designed for immunology research or clinical diagnostics, each laser beam is focused to an elliptical spot measuring ~10 to 20 µm in the vertical axis, that is, the direction of the flow stream. A typical flow cytometer counts tens of thousands of cells (or other particles) per second. For this reason, peak-to-peak output power variations are defined over the 20-Hz to 20-kHz frequency range, and rms output power variation is defined over the entire 20-Hz to 20-MHz range.
For a clinical instrument designed for blood cells, the rms noise of the laser should always be <0.1%. When measuring smaller particles in the blood, such as platelets, the main signals (forward absorption and side scatter) are smaller, so a laser with even lower noise will be required in order to achieve the same rCV value. (Usually this means a laser with no mode hopping.)
Conversely, for instruments counting larger particles, such as phytoplankton, which are studied in oceanography, these same signals will be larger, so slightly higher laser noise may not affect test results. And similarly, for fluorescently labeled cells, smaller cells will produce smaller signals, so they need lower-noise lasers to achieve good separation and localization of the dot plots.
When following the immune response of COVID-19 patients, for example, this low noise can be critical to delivering the requisite discrimination between different CD4 and CD8 subsets of T cells1. Viruses such as the coronavirus are far too small to be detected individually, but they are increasingly counted in flow cytometry by attachment to inert (usually gold) nanoparticles. The small size of these particles again demands low laser noise.
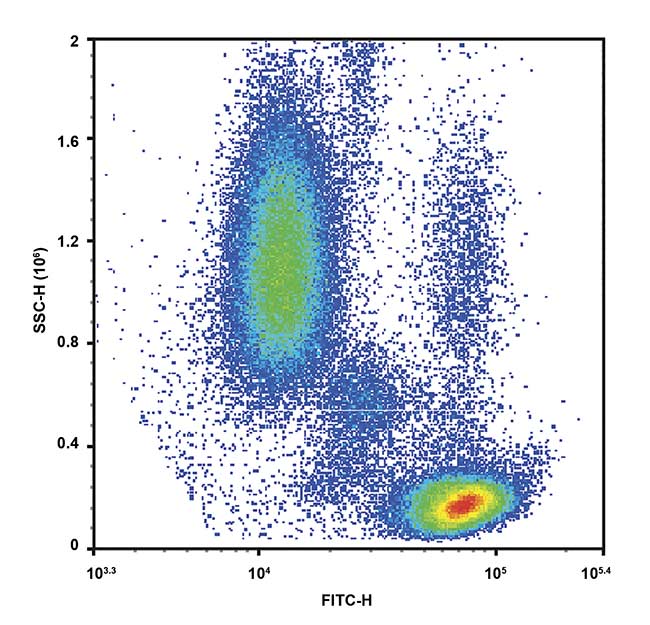
An example of a high signal-to-noise ratio, with data separation and signal exceeding the noise.
Courtesy of ACEA Biosciences (an Agilent company).
Laser beam quality. The quality of a laser beam (M2) specifies how well it can be focused to a small spot. The perfect (i.e., theoretical best case) laser beam has a circular cross section and the intensity peaks in the center and falls away in a smooth Gaussian distribution. The way such a beam propagates through focusing optics can be calculated very precisely by a design engineer, using commercially available optical design programs. The focusing is ultimately limited by a physics phenomenon called diffraction; the perfect beam is called a diffraction-limited beam.
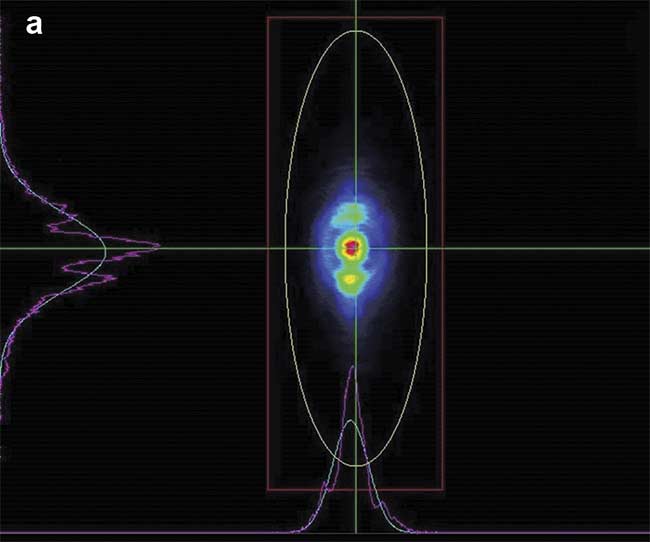
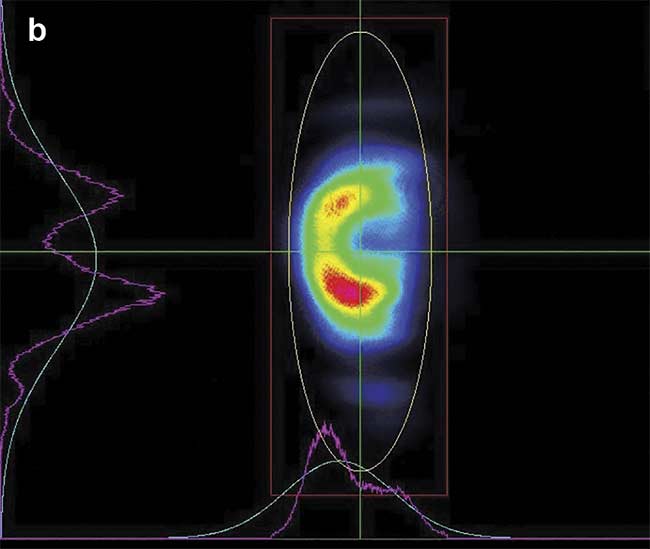
When M2 is several times larger than 1.0, the intensity pattern is both larger and more complex, with multiple bright spots. The pattern also varies significantly between the near field (a) and the far field (b), recorded at just 1 m from the laser. Courtesy of Coherent.
For applications such as confocal microscopy, micromachining, and flow cytometry, how well the beam focuses to a small spot is the most important consideration. M2 is a simple parameter that was pioneered by Coherent and others and is now widely used to describe the focusing of laser beams. To a good approximation, the focused spot diameter scales proportional to M2, where the perfect beam has a limiting value of M2 = 1. So, based on the diffraction limit, a beam with M2 = 2 will focus on a spot with a diameter 2× larger than the calculated value. However, a larger M2 value arises from higher-order modes, so in addition to a larger spot size, this results in a non-Gaussian intensity profile, often with randomly distributed hot spots. This phenomenon lowers the signal power density, while increasing noise, due to light scatter from various surfaces.
Most flow cytometers use an elliptical focused spot to minimize the noise from lateral variations in cell flow. The short vertical access is matched to the typical cell (or other target) size to maximize time resolution and sensitivity. High M2 or laser-to-laser variations in M2 will have a lower central peak intensity (lowering signals for the instrument) and increased intensity in peripheral locations (increasing noise). For clinical instruments targeting blood cells, M2 should be <1.3. Again, higher values can sometimes be tolerated in the laboratory for larger targets.
Important optics considerations
Just as it is possible to increase the signal-to-noise ratio with highly specialized laser systems, other improvements in accuracy can come from the raw optical components in a flow cytometer. The most common optical components used in flow cytometry applications are optical filters, dichroic mirrors, and lenses. Each component plays a vital role in delivering the collected light from a flow cell to the detectors.
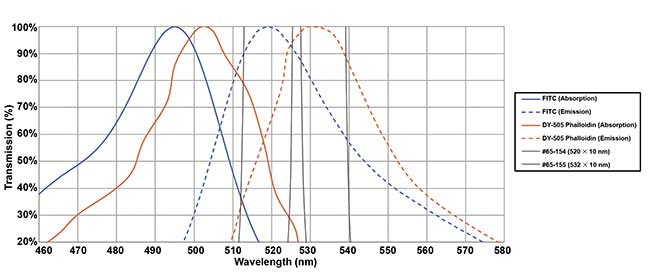
An example of optimized selection of bandpass filters. Two fluorochromes (FITC and DY-505-phalloidin) have closely overlapped spectra in both absorption and emission. But the use of narrow (10 nm) bandpass filters centered at the emission peaks maximizes the signal differential and hence the overall signal-to-noise ratio. Courtesy of Edmund Optics.
In forward scatter detection, the lasers in a cytometer are pointed directly at the detector being used to observe said scatter. Oftentimes a blocking bar is used to prevent this light from directly striking the sensitive detectors. Filters are regularly used at the entrance to these detectors to attenuate some of the intensity of laser light being scattered or fluoresced from particulates in the flow cell. Selecting the correct filter, therefore, can have a serious impact on the resulting measurements.
In side scatter detection, scientists are not concerned with blocking the intense light from the laser. They want to collect as much of the light (scatter and fluorescence) as possible and send all of it to the measurement plane. This is commonly done with two or more lenses in a system, one to collect as much scattered light as possible, and another to collimate the light and send it to the array of detectors. Often these lenses need to maintain very high transmission — and the minimization of reflection, scattering, and absorption — and constant focusing properties over broad wavelength ranges to account for the emission spectra of the particles under examination and the light sources driving the measurement.
This result is economically achieved using achromatic doublet lenses that greatly reduce chromatic (wavelength-dependent) aberrations across the visible spectrum. The focal characteristics are exactly optimized at two well-spaced wavelengths, rather than at just one wavelength, as in the case of a conventional glass singlet lens. Similarly, lower transmission through these lenses can make it difficult to distinguish between different types of cells, so a broadband antireflection coating, applied during the manufacturing process, should be used on all the surfaces.
Once collimated, the light collected from the lenses needs to be directed toward a series of detectors. This requires the use of dichroic mirrors, which are designed to reflect certain collected wavelengths and to transmit others. These mirrors are arranged in a series such that they separate certain spectral regions and redirect them to the appropriate filter and detector combination. Optimization of these components is more complex than for the ones already discussed, due to the need to specify both high-transmission and high-reflection components in an application.
Bandpass filters are often used in front of multiple photomultiplier tubes (PMTs). Filters and tubes are paired together, and their respective functional wavelength regions are taken into consideration. Bandpass filters should be selected to optimize measurements taken within these regions. One example involves the use of two PMTs, where one is intended to measure cells labeled with fluorescein (FITC) and the other is designated to measure cells labeled with DY-505-phalloidin (DY-505). This situation is challenging because the two dyes have similar excitation and emission bands. FITC has an excitation maximum at 495 nm and an emission maximum at 519 nm, whereas DY-505 maxima are at 503 nm for excitation and 530 nm for emission. In this example, both fluorophores can be excited by the same laser, which is outputting somewhere near 500 nm, so the bandpass filters selected are critical in counting each cell differently.
Assuming two 525- × 25-nm bandpass filters were chosen, this means the central wavelength of the filters is at 525 nm, with a passband from approximately 512.5 to 537.5 nm. This would be a poor choice, because it would allow the peak emission of both fluorophores through to the detectors, likely leading to double counting of cells and inaccurate data. The better choice would be to use two filters with different passbands, enabling the separation of cells counted by each detector. A 510- × 10-nm bandpass filter would be placed on the first detector, and a 532- × 10-nm bandpass filter on the second detector. This improvement comes at no cost increase to the cytometer manufacturer.
End result
All of these factors combine to deliver more of the desired light (signal) to the detectors and less of the undesirable light (noise) in the process. In other words, photonics manufacturers are improving the SNR of measurements made with flow cytometers, and better data quality has resulted in improved visibility of the data points. Manufacturing technological advancements with both optics and photonics is enabling the detection of more challenging particles at faster speeds and driving innovation for future research, particularly in fields such as virology.
Meet the authors
Patrick Sasso is product line engineer for laser optics at Edmund Optics Inc., with three years of research experience in materials science and three years of optics industry experience. He is most passionate about optics, lasers, and materials science.
Dan Callen is the product manager for OBIS lasers at Coherent Inc., with a background in engineering, manufacturing, and design. He received a bachelor’s degree in electrical and electronics engineering from Montana State University in Bozeman.
Reference
1. I. Thevarajan et al. (2020). Breadth of concomitant immune responses prior to patient recovery: a case report of non-severe COVID-19. Nat Med, Vol. 26, pp. 453-455.