With high-performance optical filters being incorporated into cutting-edge detection systems, Raman spectroscopy is finding new applications in the life sciences.
AMANDA AMORI AND MICHAEL DELAY, IDEX HEALTH & SCIENCE, SEMROCK; AND PETER BRUNT, AVR OPTICS INC.
Since its development in the mid-1920s, Raman spectroscopy has been used to study various low-frequency vibrational modes in molecular systems. In contrast to its counterpart — Fourier transform infrared spectroscopy (FTIR), which probes asymmetric molecular stretches and changes in dipole moment through absorption of radiation — Raman spectroscopy probes symmetrical stretches and changes in polarizability of a molecule via inelastic scattering of radiation. Variants now include resonance Raman spectroscopy (RRS), surface-enhanced Raman spectroscopy (SERS), and coherent anti-Stokes Raman spectroscopy (CARS).
Raman spectroscopy offers an advantage over various traditional biophysical methods — such as fluorescence and electron microscopy and x-ray scattering and crystallography — as it simultaneously preserves the integrity of the sample being studied and can be performed in real time. This makes Raman spectroscopy an excellent tool for the biological and life sciences. As it continues to gain usage in these areas, the variety of fields in which it has been applied highlights the versatility of the method. Raman spectroscopic techniques have been employed in applications including neuro-oncology, oligonucleotide targeting, optogenetics, and in vitro cardiogenic differentiation.
Recently, two studies published in Neuro-Oncology highlighted the use of Raman spectroscopy in neurosurgery for real-time tissue analysis1 and for genetic classification of gliomas2, both of which can inform surgeons of the makeup of the tissues surrounding tumors and of the tumors themselves. This knowledge can help refine the surgical strategy in the operating room.
Optical filters in Raman
In general, Raman spectroscopy studies inelastically scattered radiation. If a sample absorbs energy after the scattering event and the emitted photon is lower in energy than the absorbed photon, this is referred to as Stokes Raman scattering. However, if the sample loses energy after the scattering event, then the emitted photon is higher in energy than the absorbed photon, which is called anti-Stokes Raman scattering.
Most commonly, a laser excites a sample and a laser-blocking optical filter is positioned between the sample and a spectrometer to block the scattered light and pass the Raman-shifted signal light, which is referred to as the “fingerprint” of the molecule of interest (Figure 1).
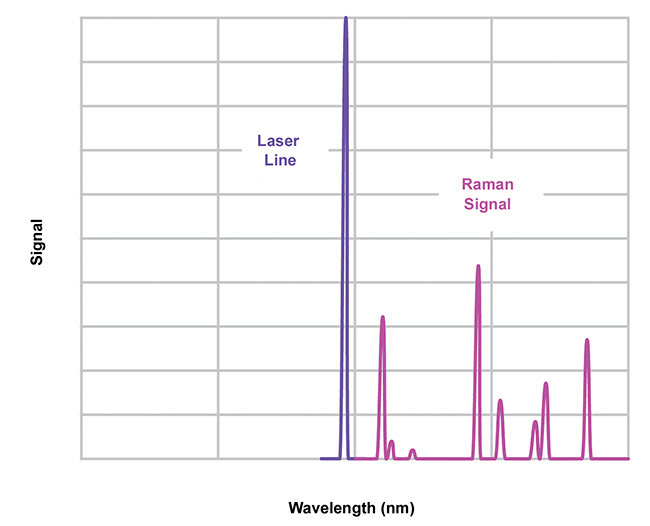
Figure 1. A Raman “fingerprint” spectrum. Courtesy of Semrock.
Raman detection systems use either one of two geometries: the standard layout, in which laser excitation and Raman emission do not share a common path; or the imaging layout, in which the excitation and emission light paths are collinear. In this geometry, two optical filters are used. The first is a laser-transmitting filter, whose purpose is to prevent any light outside the laser wavelength range from reaching the sample. Such filters can be well-suited as a laser-transmitting filter, and narrow bandpass allows use for both Stokes and anti-Stokes Raman emission.
The second optical filter, on the detector portion of the system, is a laser-blocking filter used to prevent as much excitation light from reaching the detector as possible, as the Raman signal of interest may be as low as 10-6 to 10-8 of the elastically scattered intensity. One of two filter types have been used for this blocking filter — either a long- or short-pass edge filter, or a notch filter. The long- and short-pass filters are used for Stokes or anti-Stokes Raman detection, respectively, and the notch filter can be used for simultaneous Stokes and anti-Stokes detection.
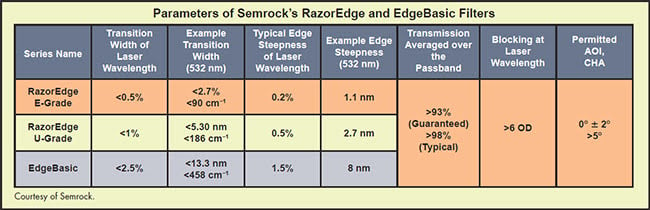
Semrock, for instance, offers two edge-filter families for laser blocking. The RazorEdge filter series has a very short transition width and high edge steepness, and is optimized for detecting Raman signals extremely close to the laser wavelength. In contrast, the EdgeBasic series has a longer transition width and lower edge steepness than RazorEdge, but is designed for high performance at economical pricing. This lower-priced solution is increasingly used in Raman detector systems that do not require detection of signals close to the laser line.
Table 1 outlines the key characteristics of the RazorEdge and EdgeBasic filter families. RazorEdge long-pass filters are available in E- and U-grade. E-grade filters are used for the most demanding Raman applications, which have the smallest Raman shifts. The transition widths are guaranteed to be less than 0.5 percent of the laser wavelength, corresponding to <2.7 nm (<90 cm-1) at 532 nm. This requires a very steep edge, which in the RazorEdge has been reduced to 1.1 nm
at 532 nm.
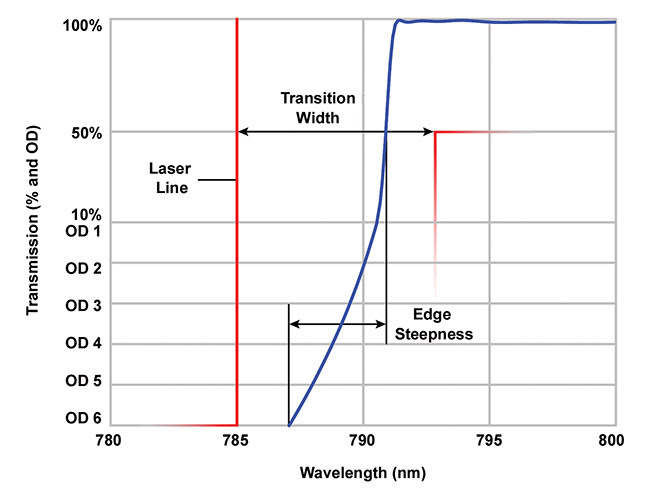
Figure 2. An illustration of transition width and edge steepness for an example 785-nm long-pass filter. OD: optical density. Courtesy of Semrock.
When choosing edge filters for Raman detection, the transition width and edge steepness are of special importance (Figure 2). The transition width is the maximum spectral distance window between the laser line — where optical density (OD) >6 — and the 50 percent transmission wavelength. The edge steepness is the filter’s actual spectral performance and is measured between the wavelengths where OD = 6 and the filter transmission reaches 50 percent. The detection of Raman signals close to the laser line requires a short transition width, which in turn requires high edge steepness.
In comparison to edge filters, notch filters block the laser light less and have less steep edges; therefore, notch filters cannot be placed as close to the laser lines as edge filters can, meaning that smaller Raman shifts cannot be detected. On the other hand, a notch filter allows simultaneous measurement of Stokes and anti-Stokes shifts. The Semrock StopLine notch filter family is often used in such Raman applications.
Many Raman systems use a collinear geometry, in which both excitation and emission light share the same path. This allows the use of the same set of optics, such as a high-power, high-numerical-aperture objective lens. Besides the two filters for laser transmitting and excitation blocking, a dichroic beamsplitter is also used, in this case, to introduce the excitation beam into the beam path. This beamsplitter must therefore also have a steep edge comparable to that of the laser-blocking filter. If it doesn’t, the ability of the system to detect Raman emission close to the laser line will be lost. Examples of such technology are shown in the table on page 37. The Semrock RazorEdge Dichroic beamsplitter, for example, is suited for the U-grade RazorEdge laser-blocking filter, as it typically has 0.5 percent edge steepness and a transition width of <1 percent of the laser wavelength. These beamsplitters have controlled flatness and reflected wavefront error, so the focal shift is limited to less than one Rayleigh range for a beam diameter of less than 2.5 mm.
Filters made with layers of dielectric materials, similar to those from Semrock, undergo shifts of their spectral features, such as edge or notch wavelength, to shorter wavelengths as the angle of incidence (AOI) is increased. This feature can be used, for example, to shift an edge closer or farther from the laser line. An edge filter can be tuned by about 0.3 percent of the laser wavelength as the AOI is increased from 0° to 8°. This reveals a further advantage of a notch filter — that it can shift by up to 1 percent of the wavelength, as AOI goes from 0° to 14°.
The hard filter coatings in both filter families provide high laser-induced damage thresholds, >1 J/cm2 at 532 nm, for pulse widths of 10 ns at 20 MHz repetition rates. The filters have less than 5 ppm wavelength shift per °C, and have been rigorously tested and proven to meet tough environmental standards.
Biology and life sciences
A deeper understanding of the mechanisms involved in Raman spectroscopy and its specific variants, coupled with a comprehensive and developed range of supporting laser sources and optics, has successfully brought Raman spectroscopy out of the materials sciences and into the medical field. It is now possible not only to image the structure of a biological sample without extensive preparation but also to probe its composition in real time.
One of the major risks in cancer diagnosis is that it often has to rely upon physical biopsy to determine presence and extent. In cases where potential cancer sites require major surgery to access, any process of diagnosis must be both efficient and accurate to minimize risk.
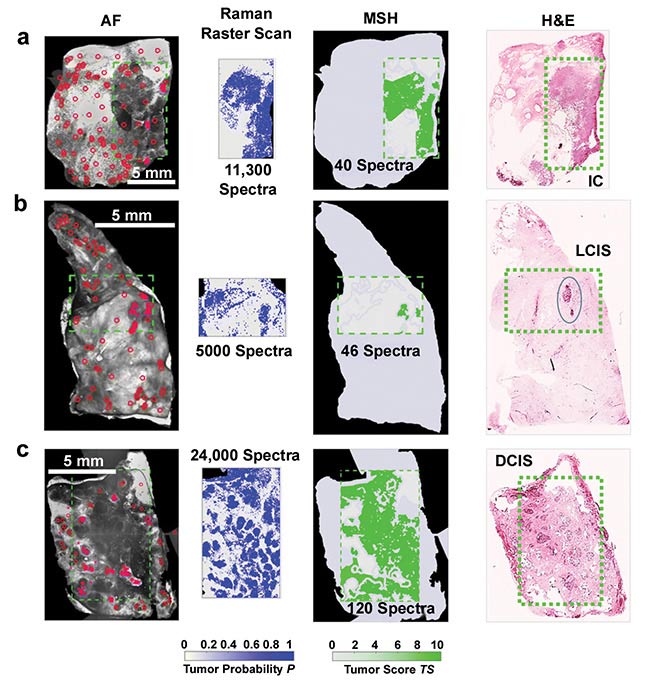
Figure 3. Multimodal spectral histopathology (MSH) diagnosis generated using autofluorescence (AF) and raster scan Raman measurements of breast samples. Diagnosis for Raman raster scan is presented as tumor probability (P) (output of the classification model), while the diagnosis of each segment in the MSH is presented as tumor score (TS). Segmentation and sampling algorithms use AF images to focus Raman measurements to suspicious regions, greatly reducing the number of spectra required for accurate diagnosis. Areas detected as tumor in the first round of MSH measurements are sampled by further Raman measurements. Invasive carcinoma (IC) (a); lobular carcinoma in situ (LCIS) (b); ductal carcinoma in situ (DCIS) (c). H&E: hematoxylin and eosin stain. Courtesy of Ioan Notingher.
The combination of label-free microscopy with new developments in image analysis is making Raman spectroscopy an extremely useful option for clinical histopathology (Figure 3), bringing a more objective solution to an often subjective field. While it is the subject of a much wider discussion, the use of big data to drive statistically quantifiable models for diagnosis will likely have an impact — for example, toward the possibility of semiautomated histopathology driven by machine learning.
One example of this can be found in recent work by Shipp and colleagues3. Here, the use of a multimodal microscopy approach that combines tissue autofluorescence confocal imaging with Raman spectroscopy allows rapid identification of submillimeter cancers through trained algorithms. This is followed by a rapid, selective verification using Raman spectroscopy.
By combining these techniques, Shipp and colleagues were able to avoid the major drawback of Raman scanning microscopy — the slow speed of most scanning techniques. For example, it is possible to reduce the number of Raman scans to just 40 compared to 11,300 using a more traditional raster scanning protocol. Microspectroscopy with this method would therefore allow surgeons to quickly distinguish cancer cells from healthy tissue during resection, reducing the potential impact of the surgery on the patient and improving the cosmetic result.
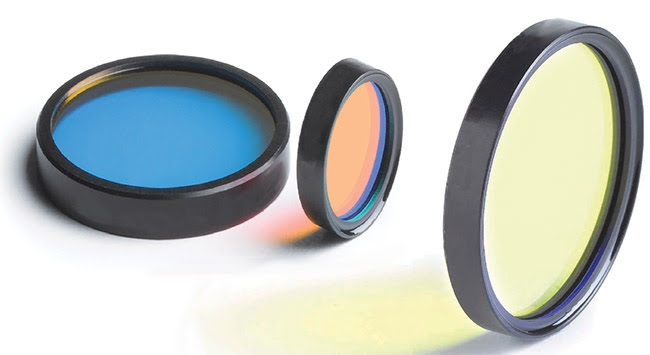
Courtesy of Semrock.
Developments in this area continue to focus on increasing the speed of imaging through selective sampling while maintaining a high degree of sensitivity and specificity compared to other techniques.
The ability to probe the vibrational states of molecules in biological applica-
tions has yet to be fully exploited, but significant developments have been made. Raman spectroscopy gives us an objective, empirical fingerprint that has been added to the scientific community’s diagnostic toolbox. Combined with other microscopy techniques, or used alone in stand-alone measurements, Raman spectroscopy allows detection of molecular differences to high accuracy.
Meet the authors
Amanda Amori is an applications scientist at IH&S Semrock, based in Rochester, N.Y. She has a Ph.D. in physical chemistry from the University of Rochester, where she studied the photophysical properties of quantum confined nanomaterials; email: [email protected].
Michael Delay is an applications scientist at IH&S Semrock. He has a Ph.D. in elementary particle physics from the University of Washington, and studied intracellular ion dynamics using fluorescence while on the faculty at the University of Calgary. He later held positions in industry involving managing software development and business opportunity identification at Axon Instruments, directing research and development at TILL Photonics, and developing live animal imaging methods at INDEC Biosystems; email: [email protected].
Peter Brunt is vice president of sales at AVR Optics in Rochester, N.Y. He has a master’s degree in physics and astrophysics from the University of Leeds in England. He is formerly of Laser 2000 (U.K.), where he worked closely with research scientists and industrial customers to guide and develop solutions for a wide variety of photonics applications. At AVR Optics, he has brought Laser 2000’s ethos of science-based solutions to the U.S. research community; email: [email protected].
References
1. B. Vaqas et al. (2018). Raman spectroscopy: a novel tool for intraoperative guidance in surgical neuro-oncology. Neuro-Oncol, Vol. 20, Issue 1.
2. L.J. Livermore et al. (2018). Rapid genetic classification of gliomas using Raman spectroscopy. Neuro-Oncol, Vol. 20, Issue 3.
3. D.W. Shipp et al. (2018). Intra-operative spectroscopic assessment of surgical margins during breast conserving surgery. Breast Cancer Res, Vol. 20, Issue 69.