High-volume production of digital cameras for mobile phones has led to a need for high-quality, high-speed in-line testing. A new ultrafast wavefront analyser can test complete trays or wafers — including spherical and aspherical optics — in large quantities over the full aperture in seconds per lens.
Dr. I. Erichsen, Dr. S. Krey and A.K. Ruprecht, Trioptics GmbH, Wedel, Germany, and M. Cherrier,
Trioptics France, Villeurbanne
The introduction of digital cameras into mobile phones has led industry to produce increasingly larger quantities of lenses for camera objectives. Facilitated by a recently introduced technology for mass fabrication of micro-optical elements in large quantities on single wafers, this has had an effect on the demand for test instruments. With the constraints of speed and high measurement accuracy, these instruments also must offer automated wafer alignment procedures and positioning algorithms.
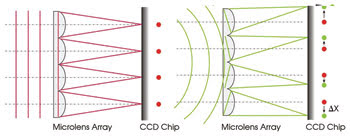
Figure 1. The Shack-Hartmann measurement principle uses a (reference) microlens array to visualize deviations from an ideal plane wavefront, which can be measured as special displacements on a CCD camera chip.
Shack-Hartmann-based measurement systems, which provide real-time wavefront measurement and analysis of spherical and aspherical optics over the full aperture, are best suited to meet these requirements because of their high dynamic range, accuracy and speed. Measurement times of less than 3 s per lens can be realized.
The basic design of a Shack-Hartmann sensor consists of a CCD camera that is placed in the focal plane of a microlens array. An incoming wavefront is sampled by the lenses of the microlens array, and the foci form a spot pattern — which is evenly spaced in the case of a plane wavefront — on the camera. Any aberration introduced by the optics under test, such as a sample lens, leads to a curved wavefront with small local wavefront tilts. These induce a measurable shift of the respective focus spot positions. Integration of the obtained slope information enables reconstruction of the wavefront profile with high accuracy.
With state-of-the-art computers, this wavefront reconstruction can be performed within the CCD camera frame rate; i.e., within fractions of a second, even if microlens arrays with a large number of lenses are used to obtain high spatial resolution. The dynamic range of a Shack-Hartmann sensor, however, depends heavily on the routines that assign each measured spot to the corresponding microlens. A wavefront can be reconstructed only when this correlation is maintained. Especially in the case of wavefronts with a stronger curvature, sophisticated algorithms are required because the simple assignment of a predefined searching area in the CCD plane of the size of a microlens is no longer sufficient. Nevertheless, modern techniques achieve wavefront dynamic ranges of up to more than 1000 λ.
Because of this high dynamic range, Shack-Hartmann sensors can measure wavefronts with strong aberrations — a range of applications no longer accessible with simple interferometer setups. Those setups usually solve the lack of dynamic range by using diffractive null optics, but they must be specially made for each type of measured lens — a process that is less flexible and much more costly.
Commercial test system features
It is well established that a known wavefront can be decomposed into a linear combination of Zernike polynomials that describe the typical optical properties and potential errors of a lens or lens system, such as defocus, coma or astigmatism. The effects of aberrations also can be characterized by calculating the point spread function or the modulation transfer function (MTF) of the optical system from the wavefront characteristics.
Different from the previously used imaging quality tests of the final product — for example, MTF or test chart projection techniques — the wavefront measurement leads to a spatially resolved map of the refraction properties of the lens. These can be compared easily with design data or against a master sample, and effects of local surface defects, refractive index variations or shape deviations can be detected.
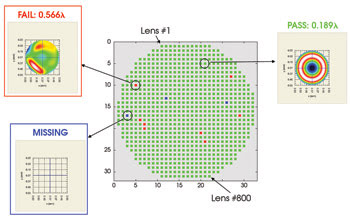
Figure 2. Typical measurement results show good, bad and missing lenses on a wafer within the fully automated quality check for mass market production of mobile phone objectives.
Additional requirements for test equipment in a wafer-level production environment are fully automated lens-positioning procedures, which include lateral positioning and autofocus, as well as high-speed wavefront measurement and analysis, and sorting of the lenses into various quality classes. Also, the user interface must be simple, and loading and unloading of the wafer must be easy. Such an automated Shack-Hartmann-based measurement system has been introduced by Trioptics.
The WaveMaster PRO Wafer features a high-resolution Shack-Hartmann sensor that uses an arrangement where the sample lens is illuminated by a point light source and the lens pupil is imaged onto the wavefront sensor. This is done via a telescope system that also magnifies the wavefront for maximum use of the sensor area and dynamic range. The telescope system can be exchanged for adaptation to a wide variety of lenses under test. The point light source is implemented by a high-quality, high-numerical-aperture microscope objective lens illuminated by a collimator with a fibre- coupled laser light source.
Simple operation
After a wafer is inserted into the wafer holder, the instrument determines the rotation as well as the lateral offset of the lens pattern with respect to the corresponding “tray file.” A unique tray representation file must be generated once for each type of wafer. It is then used by the software to find the optimum measurement conditions for each single lens on wafers of the same kind, resulting in reproducibility of the measured wavefronts of better than l/200 rms.
The fine-positioning algorithms are based on the real-time Zernike analysis, and they use tilt and coma coefficients for fast X-Y positioning. Besides a lateral-positioning algorithm, a fine-autofocus one is applied based on targeting a previously defined defocus Zernike coefficient. Bending of the wafer under test, which usually is caused by gravity or inner stress, is compensated for by a tracking mechanism that corrects the position of the imaging system relative to the pupil of the measured lens.
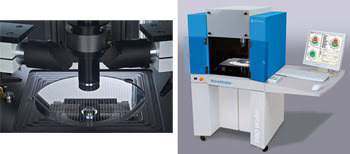
Figure 3. The Trioptics WaveMaster PRO system performs fully automated measurement of mass-produced lenses at the wafer level at a rate of 2 to 5 s per lens.
During measurement of a wafer, a real-time analysis of each wavefront is performed, and each lens is classified directly according to selected pass-fail criteria. A variety of criteria can be chosen, including comparison with theoretical lens data or with a master lens.
Several of these instruments now are in use at industrial sites, where they are measuring large wafers with diameters up to 200 mm and are holding several thousand lenses. Measurement time per lens is typically 2 to 5 s, depending upon the chosen tolerances for the fine-positioning algorithms and upon the exact measurement conditions. This performance exceeds that achieved by any previous method and facilitates high-capacity production of quality lenses for mass applications.
Contact: Iris Erichsen, Trioptics GmbH; fax: +49 4103 18006 20; e-mail: [email protected].