Marie Cherrier, TriOptics GmbH
Intraocular lenses (IOLs) are artificial
implants used to replace the human eye crystalline lenses in patients with cataracts.
The standard IOL is designed to match the patient’s eye to provide good images
of objects at infinity. The tendency is to compensate for all defects of vision
so that the patient does not need to wear glasses at all. IOLs that can provide
good vision simultaneously for near, intermediate and far distances must be of multifocal
or accommodative design.
Powerful measurement systems are required to test these innovative
and increasingly complex lenses. The OptiSpheric IOL (Figure 1) and the WaveMaster
IOL (Figure 5), both from Trioptics GmbH, feature two measurement principles: a
direct imaging setup, as described by the European/ISO 11979 standard, and a Shack-Hartmann
wavefront sensor-based measurement system.
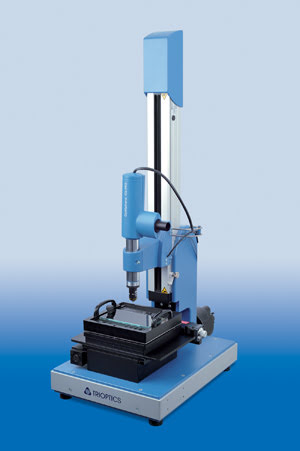
Figure 1. OptiSpheric imaging test bench with tray for several lenses.
What to measure
The most important parameter is the power of the intraocular lens,
representing its ability to focus into the retina plane. By measuring the effective
focal length (EFL) of the sample, its power can be calculated. The EFL can be measured
in air or in situ using a model eye. According to ISO 11979, the model eye consists
of a small chamber with plane-parallel plates as top and bottom surfaces, which
contain a saline fluid. The IOL is placed inside, and another achromatic lens is
used as an artificial cornea lens. With more complex IOLs, manufacturers also are
interested in the power map of their lens showing the local power in each point
of the lens in addition to the mean power of the IOL.
An important way to characterize the quality of an intraocular
lens is to look at its optical aberrations. These can be obtained by measuring the
wavefront. The resulting analysis provides information about spherical aberrations,
coma, astigmatism and defocus, using Zernike decomposition, as well as field curvature
or distortion, using Seidel analysis. It also offers the possibility of quantifying
any deviation from the design of the lens.
Another parameter necessary to assess the performance of an IOL
is the modulation transfer function (MTF), which describes the ability of an optical
system to transfer the details of an object to the image. It can be measured either
directly by analyzing the line or point spread function (LSF or PSF) resulting from
imaging an ideally infinitesimal thin line or point of light, or by calculating
it from the measured wavefront.
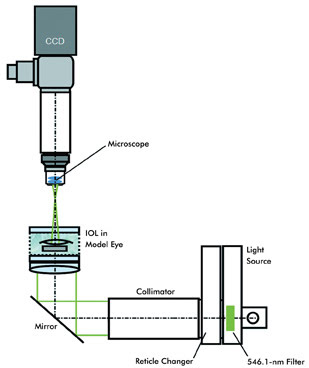
Figure 2. OptiSpheric imaging bench: Setup for measurement in situ. IOL = intraocular lens.
Imaging test bench
The optical setup of the imaging test bench OptiSpheric IOL has
been designed in agreement with ISO 11979 (Figure 2). A highly corrected collimator
projects the image of a target to infinity. The parallel beam enters the lens under
test and emerges from the IOL as a convergent beam focusing in the focal plane.
The image of the target is collected by the objective lens of the microscope and
is focused on the high-resolution CCD camera. The sample holder is a self-centering
mount for testing the IOL in dry conditions or for using a model eye to test in
situ. For production test conditions, the instrument is equipped with a complete
tray of IOLs in air or in situ.
The effective focal length is calculated from the measured magnification
of the sample as proposed in ISO 11979. The target used in this case is a double
slit. In the best focus position, the size of the magnified double slit is precisely
determined (1/30 pixel accuracy) – and, thus, the EFL and, with it, the power of the lens.
The accuracy reached for the measurement of the power is ±0.1 for diopters from 2
to 40, determined by well-known reference lenses certified independently.
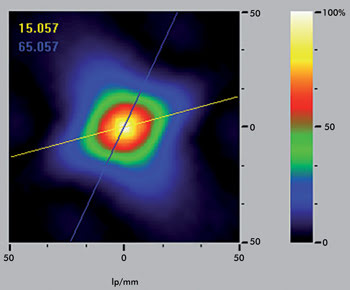
Figure 3. OptiSpheric imaging bench: 2-D display of the MTF with astigmatism axis.
Multifocal lenses usually have several image planes. In Figures
4a and b, the measurement results of an astigmatic lens are shown. In the camera
view, the typical behavior can be seen: The first focal plane focuses only the horizontal
slit, whereas the second focuses the vertical slit. The intermediate plane images
both horizontal and vertical directions. Measuring with cross or square targets
enables seeing both focusing directions in one setup.
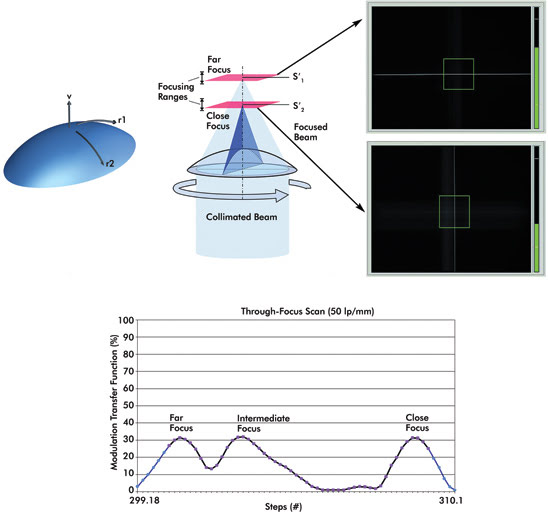
Figures 4a and 4b. OptiSpheric, multifocal IOL: Through-focus scan showing two focal planes.
The MTF is determined by using the magnitude of the Fourier transform
of the LSF or PSF; i.e., the response of an imaging system to an infinitesimal thin
line or point of light. The target used is either a slit or a crosshair. The intensity
profile of the target is scanned electronically in both the radial and tangential
directions. By using Fourier transform techniques, the MTF is calculated and displayed
on the PC monitor in real time. To display two-dimensional MTF and have a description
of the lens in all azimuths, a pinhole target can be used in association with a
high-resolution, low-noise camera.
Wavefront measurement bench
The WaveMaster IOL is based on the analysis of the transmitted
wavefront through the IOL measured with a Shack-Hartmann sensor. Wavefront sensors
are well-known for the measurement of the optical characteristics of the eye but
also can be used to determine the quality of the IOL lens itself.
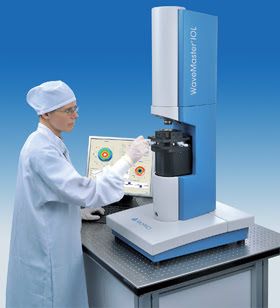
Figure 5. WaveMaster wavefront measurement test bench.
The standard design of a Shack-Hartmann sensor consists mainly
of a CCD camera placed in the focal plane of a microlens array. An incoming wavefront
is sampled by the lenses of the microlens array, and the foci form a spot pattern
on the camera, which would be evenly spaced in case of a plane wavefront. Any aberration
introduced by the sample lens leads to a curvature of the wavefront, resulting in
small local wavefront tilts. These induce a measurable shift of each focus spot
position. An integration of the obtained slope information allows for reconstruction
of the wavefront profile with high accuracy.
This instrument employs a high-resolution Shack-Hartman sensor
in reverse projection setup. In this configuration, the sample lens is illuminated
by a point light source, and the lens pupil is imaged onto the wavefront sensor
by means of a telescope system that also magnifies the wavefront for maximum utilization
of the sensor area and dynamic range. The point light source is set up by a high-quality,
high-numerical-aperture microscope objective lens illuminated by a collimator with
fiber input and a fiber-coupled laser light source (Figure 6).
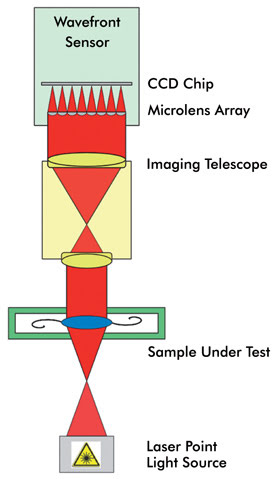
Figure 6. Infinite conjugate setup for wavefront measurement.
The measured wavefront can be decomposed into a linear combination
of Zernike polynomials that describe typical optical properties and errors of a
lens or lens system in the exit pupil, including defocus, coma, astigmatism or spherical
aberrations. This polynomial decomposition gives access to different kinds of aberrations
of the sample. These have basically two sources: aberrations directly linked to
the design of the lens, most likely spherical terms, and asymmetric contributions
resulting from lens errors.
Using the correlation between the radius of curvature of the wavefront
and the Zernike defocus coefficient, the vertical displacement of the point source
enables an accurate measurement of the EFL. A series of wavefronts at various focus
positions is recorded. By analyzing the change in the defocus term, the overall
EFL and power can be precisely determined. In addition, the power map can be calculated
directly from the wavefront, which also contains the information about the local
EFL for each point inside the lens aperture.
The wavefront measurement and its further analysis also provide
a full spatially resolved description of the imaging characteristics of the lens
under test. One advantage of using wavefront measurement to determine the MTF of
a lens is that the full 3-D information is available. Besides the advantage of getting
the spatially resolved information in one measurement, it allows for the determination
of the principle axes of the lens.
To answer the new needs evolving from the increase in complexity
of the IOLs, optical measurement instruments have improved and widened the range
of possible measured parameters as well as available accuracy and speed. The two
instruments presented offer complementary parameters for characterization with fast,
robust and accurate measurements in both cases. The accuracy of the instruments’
measurement results is traceable to international standards.
Meet the author
Marie Cherrier is product manager for IOL instruments at Trioptics
GmbH in Wedel, Germany; e-mail: [email protected].