Have a rainbow of applications
Dr. Aaron Gage and Dr. Andrew Tatsch, Ocean Optics Inc.
Color analysis is a powerful detection tool. Its ability to ferret out information about the absorbance and reflectance properties of a material makes it ideal for identifying a range of characteristics. Applications surround us, from paint-matching systems at hardware stores to scientific methods for studying how birds react to the colors of plumage. The level of detail and the quality of data required in color analysis systems vary according to complexity of the application, which can be as simple as a color imager or as sophisticated as a laboratory-grade spectrometer.
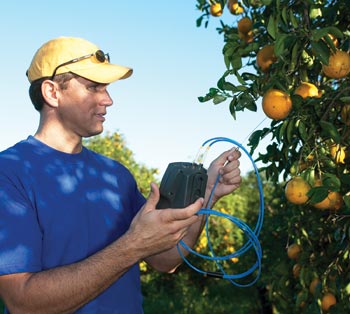
Whether monitoring the color of raw stock or finished goods, flexibility and the correct size instrument can make the process manageable. In citrus, color can indicate ripeness, which can be tested before the fruit is harvested.
Color analysis typically involves using one of various mathematical models of the human eye known as an observer. Essentially, an observer mimics the luminous efficiency functions of the eye so that an instrument will read directly what the eye would perceive. The filters chosen for a color sensor define the observer for the system. In the case of a CCD imager, those filters, typically based on two common observers standardized by CIE, are defined by the manufacturer. In our spectrometers, we capture the spectral data for the sample under test without any filter-based observer. Instead, using software, we mathematically apply those luminous efficiency functions to get the same response that the CCD sensor gives directly.
In the case of a commercial off-the-shelf color imager or colorimeter, the user is at the mercy of whatever theoretical illuminant and observer the manufacturer has designed into its hardware; the observer cannot be changed. The software implementation using the spectral data from the spectrometer provides considerably more flexibility. Because the observers for a spectrometer are applied algorithmically, the user can redefine them, not only switching between standard models but also defining arbitrarily observers tailored to the project. For the simple matter of matching paint, the choice of observer may not matter, but if a scientist is, for example, using a mathematical model to show how birds respond to color, that model can be substituted for the observer. Such customization provides powerful data-acquisition capabilities for demanding applications.
Spectrometers offer more than just easy customization. They can provide significantly more information than a black box chromaticity solution such as a filtered photometer or color imager. A user trying to characterize a light source not only can measure emission wavelengths, for example, but also gather data such as brightness, total power output and so on. Comprehensive incoming data yields quality outgoing data.
Color analysis at work
So how are these systems being used? One common application is cancer diagnostics. The simplest techniques use CCD-based systems to analyze the color differences between the cells of various tissues; e.g., skin cancer systems can assess moles for symmetry and color change – a method that does not require a standard reference for comparison. For more detailed analysis, a spectrometer-based system not only can analyze color but also can measure other modalities simultaneously, perhaps registering a near-IR absorbance or a Raman spectrum. Because studies have detected specific spectral signatures for malignant cells, such a multimodal approach allows doctors to acquire independent confirmation of findings.
In the industrial sector, color analysis applications range from food production to process control. An orange juice producer may have a trademark color for its product that requires multiple juices to be mixed. Simple color analysis systems on each production line can monitor this process to ensure consistent results. A similar process could be used to assess the value of raw cotton, for example, the price of which is based on its whiteness.
In China, our UV spectrometers are used in a plastics factory to guarantee consistent color in polymers. The goal is to produce a uniform shade: Black or pink plastic used in cell phone cases, for example, should look the same across the entire production run. To create the colored material, manufacturers add a mix of pigments or dyes to neutral-color plastic. The tinted plastic is formed into filament and cut up into what is known as chop – polymer pellets that can be melted and formed. Before the extruded filament is cut into chop, the spectrometers check it for color match. If the system detects any variation, a software program adjusts the levels of pigment to ensure that the shade remains constant throughout the day.
Another common industrial color analysis application is LED testing. LED manufacturers sometimes must test the emission wavelength of each device to ensure that the output is within 60.5 nm of its specification. Besides providing quantitative data, spectrometers assess metrics such as brightness and output power for efficiency calculations.
Practical considerations
Of course, the industrial environment introduces challenges for sophisticated optical systems. Factory floors and food processing plants can subject instruments to heat, humidity, particulate contamination or even daily washdown requirements. The cable of a fiber-coupled spectrometer can be run out to the test point in a hostile environment while the spectrometer itself remains under controlled conditions in a cabinet or room. A color imager similarly could be placed behind a window, but this setup would require careful attention to optical design to avoid the introduction of chromatic aberration. Alternatively, the system could image through a coherent fiber bundle, but this arrangement would limit the field of view as well as add significant cost.
Data also can be affected by changes in system properties. Although the spectral response of a color CCD imager is unlikely to change, any light source used will gradually dim over time, affecting the data and potentially introducing error. If an application using a fixed lamp operates for 500 hours, the spectral properties of the lamp will change over the course of that measurement and affect the data. An autoexposure or white balance setting on the camera could address this concern but should be implemented carefully because such schemes can themselves introduce error.
Spectrometers themselves do not always operate uniformly. To ensure consistency, we can compute a radiometric calibration based on a NIST-traceable standard to quantify the spectrometer’s response function, regardless of the light source. Alternately, software can correct for changes in the light source on a pixel-by-pixel basis, either by exploiting a nonabsorbing region of a sample spectrum or by using a second spectrometer to monitor the lamp directly. Suppose a technician touches an illumination source, leaving oils that alter the output spectrum. By measuring the lamp itself, the system acquires enough information to compensate. To maintain accuracy, the correction can be performed every few measurements, or even every measurement.
So far, the discussion of spectrometers has referred to laboratory-grade instruments, but for agricultural and industrial applications, portable field-grade devices such as those enabled by Ocean Optics Inc.’s Jaz product line are suitable. Designed around stackable, modular and autonomous components sharing common electronics and communications, a typical Jaz setup is about the size of a few decks of cards stacked atop each other – small enough to be carried around by floor technicians or installed on a farmer’s tractor. The device integrates a CCD detector and user-selected grating or slit options. A powerful microprocessor and onboard display with data logging capability dispense with the need for a PC. The price and a variety of options make the system flexible and appropriate for many applications.
Color analysis provides a powerful tool for assessing substances, light sources and biological specimens across a wide array of disciplines. Engineering has risen to the task, with color analyzer technology varying from simple, economical CCD-based imagers to more sophisticated spectrometers that provide a broader range of data. With the introduction of handheld spectrometers that span the gulf between the simple and complex varieties, color analyzers are likely to gain entry into even more markets.
Meet the authors
Aaron Gage is a software engineering manager and Andrew Tatsch a senior applications scientist, both at Ocean Optics Inc. in Dunedin, Fla.; e-mail: [email protected].
How they work
Perhaps the most basic approach to color analysis is a commercial off-the-shelf color CCD camera. This device does not contain dispersive elements, but with the optimum software, it can compare a sample under test against a standard to determine whether the two match. Besides cost, the advantage to this approach versus a fiber optic spectrometer is that the detector produces a two-dimensional image, whereas a conventional spectrometer analyzes only a point on the object under test. For applications such as color matching or for detecting the transition from one object to another based on color, the imagers can provide an effective, economical solution.
What’s more, advances in dichroic filter technologies can enhance imaging at red, green and blue wavelengths, essentially tuning the spectral characteristics of the image sensor to reflect or transmit over specific bands to produce the optimum response. New processes also make it easier to produce multilayer coatings, so that a single CCD array becomes a multispectral imager: Instead of measuring color at three wavelengths, one can measure up to 11 wavelengths.
Typical color imagers do have their limitations, however. CCD-based color analyzers, and even filter-based colorimeters that use silicon photodiodes, measure only a limited range of wavelengths. Physiologically speaking, human color perception is centered on three color stimuli (approximately red, green and blue), but each response spans a broad spectrum of wavelengths. This has been modeled by the CIE as the (x,y,z) color space, which is illustrated by the (x,y) chromaticity diagram for color matching.
In generating color images from the monochromatic sensitivity of a CCD detector, manufacturers overlay the device with red, green and blue filters. These define a triangle on the (x,y) chromaticity diagram but cannot encompass the entire range. In other words, the response of the color CCD imager is not a true representation of all the colors the human eye sees.
What we think of as color is essentially a broadband response between 380 and 780 nm, but analysis by a color imager must take that spectral data and collapse it down to a three-point representation. Certain regions of the color space will never be encompassed by even the best CCD imagers. Transforming the response from a broadband spectrum to the three-point representation requires sacrificing a significant amount of information.
As a result, imager-based analyzers are strongly dependent on lighting conditions because a material’s appearance tends to vary depending on the illumination. With the right lighting, two materials can appear to be identical in color even if the reflected spectral power distributions differ – an effect called metamerism. If the lighting changes, however, the colors can look significantly different. Controlled lighting conditions thus become important for consistent results. A spectrometer, in contrast, captures the light reflected, transmitted or emitted by a sample and uses a dispersing element to split it into discrete wavelengths. Because the instrument captures the complete spectral power distribution rather than merely measuring power at three specific wavelengths, the resulting color measurement is more robust.