Mapping the diverse probability distributions that arise from the manufacturing process can help to cut costs and ensure consistent quality for aspheres.
ULRIKE FUCHS, ASPHERICON GMBH
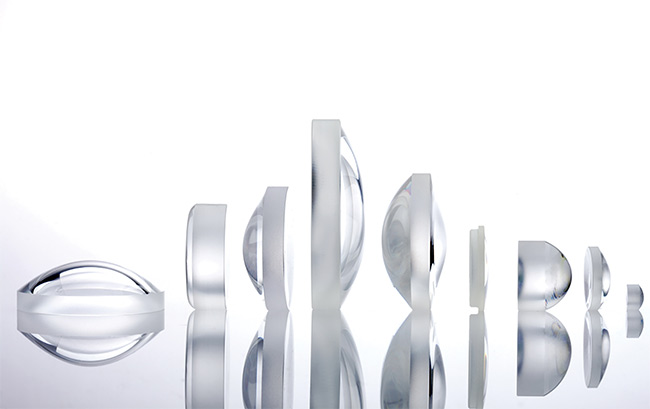
Courtesy of asphericon GmbH.
The production of optical
elements has changed significantly over the last two decades, mostly due to the ever-increasing demand for optical systems from end markets, including consumer products, optical communications, laser materials processing, classic photographic and cinema lenses, and even the space sector.
For many of these applications, special manufacturing processes have been established to produce lenses and mirrors that are particularly suited to their respective end-use requirements in terms of quantity and precision. Such processes may include injection molding, diamond turning, computerized numerical control (CNC)-based grinding and polishing, and, now, additive manufacturing. For all of these applications, aspherical lenses and mirrors are now firmly established solutions along with classic spherical optics — and even freeform optical surfaces are increasingly used.
Twenty years ago, aspheres — or lenses with surface profiles that are not portions
of a sphere — were not widely used in optical systems because they lacked sufficient quality and availability. Today, things are different. These lenses are no longer custom-designed for only a handful of optical systems but are manufactured in large batches for high-volume applications. This shift in scale has directly
affected the work of the optical designers who are responsible for defining tolerances in the systems in which aspheres are used. And it has required designers to adopt a deeper understanding of the processes underlying asphere production.
The CNC-based grinding and polishing
techniques used to produce aspherical glass lenses, for example, require designers to consider the statistical distributions of tolerances in order to achieve predictable and consistent performance for finished optical systems.
An optical production process is always based on a two-part sequence: the setup of the machining system followed by the subsequent production of the lenses. For very small batch sizes, reliably predicting the expected distribution of measurable variables within the tolerance window becomes impossible. The setup process introduces too many variables.
Experience dictates that statistical considerations only make sense when they are based on a sample size of several
hundred units. When more concrete knowledge of the underlying production statistics is available, however, the
approaches presented below can be applied in order to successfully predict variables within the tolerance window for samples as small as 40 to 50 units, although a larger sample size is always more advantageous.
One standard method for tolerancing optical elements or systems is to perform a Monte Carlo analysis, a quantitative analysis method used to identify risk levels in achieving objectives. Such analyses are common functions in optical design software packages, and they assume different weights and distributions of parameters in the tolerance intervals.
In particular, when aspheric surfaces are involved, novel distribution functions arise due to the subaperture polishing process, which is fundamentally different from the polishing process used in the production of spherical surfaces.
Because the use of aspheric surfaces in optical design offers many advantages in terms of optical function and size and weight reduction, optical designers need reliable methods to achieve desired tolerances for these surfaces. Fortunately, in recent years, the high-precision mass-production of aspherical lenses has enabled the manufacture of large batches up to several thousand pieces.
The manufacturing process employed at asphericon involves measuring every asphere with respect to various parameters. This approach utilizes a huge database with an incredible amount of information that is used to investigate the correlation between specified tolerance values and measured data sets. Resulting probability distributions of these measurement data sets are analyzed to develop a robust optical tolerance process.
It will be useful to explore the results of this work. Below, standard tolerances — such as center thickness and radii of curvature — are discussed, as well as surface shape variations such as root mean square (RMS) slope tolerance. Based on the statistics shared, batch-to-batch variations can be analyzed.
Probability distributions
To obtain reliable output from tolerancing simulations, the optical design engineer
should first identify parameters for tolerancing surface form deviation and then analyze how batch size influences outcome to establish reliable probability functions.
Figure 1 shows common probability distributions that can be used in optical design software. The uniform and normal distributions are widely used, as well as the endpoint description. Parabolic, double-Rayleigh, and beta-function distributions are all more exotic but can be useful in the tolerancing process.
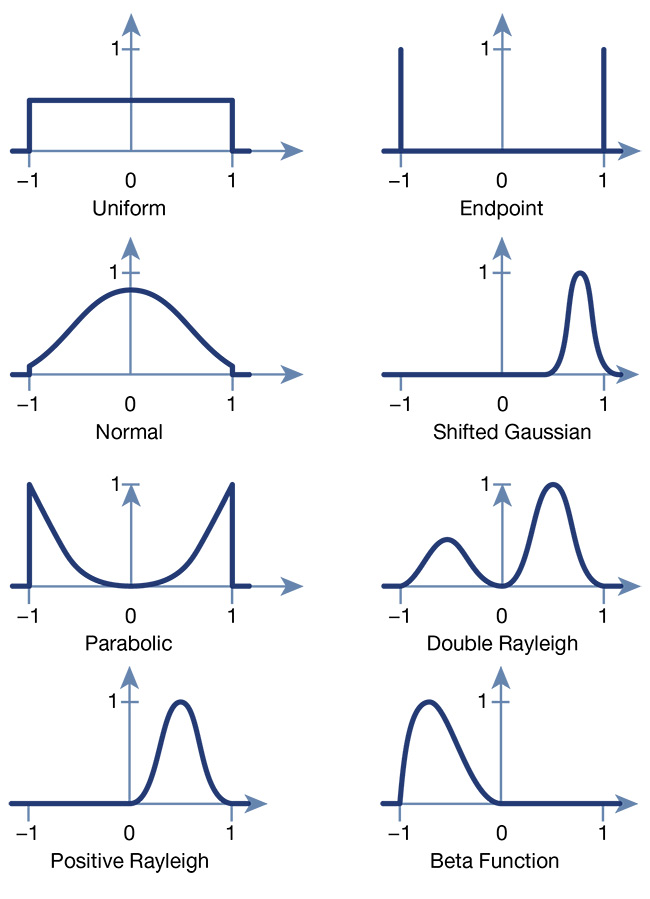
Figure 1. Probability distributions for the optical design tolerancing process. All distributions are normalized to account for the same number of lenses. Courtesy of asphericon GmbH.
Several considerations are involved in selecting which distribution is most suitable for a particular application: the batch size, the manufacturing process to be employed, and the specific grinding and polishing techniques to be applied.
Distributions showing variations of different parameters hold true for all of the subaperture polished lenses discussed here. The differences in polishing technique when blocking several lenses together or when processing single lenses show distinguished statistical distributions. Thus, when tolerancing optical systems, the optical designer must have some of this knowledge available beforehand.
To illustrate how we use this statistical information to select the most suitable probability distribution for an optical system, we analyzed a large series of aspherical lenses that asphericon ground and polished using CNC machines. More specifically, we analyzed an aspherical lens from asphericon stock — the AHL25-20, with a focal length of 20 mm. As part of this analysis, we examined the RMS of the irregularity of the surface form deviation (RSMi), the radius of curvature, the center thickness, and the slope RMS.
The statistical basis for our analysis
was a sample size of 4,922 lenses manufactured in 19 different batches. Each batch included 400 to 600 lenses. A sketch of the lens is shown in Figure 2. The specification of this lens is more than 15 years old, so it originally only defined tolerances for radius of curvature, center thickness, and RMSi surface form deviation. Slope deviations, however, can now also be analyzed to provide valuable insights into the results of various polishing techniques.
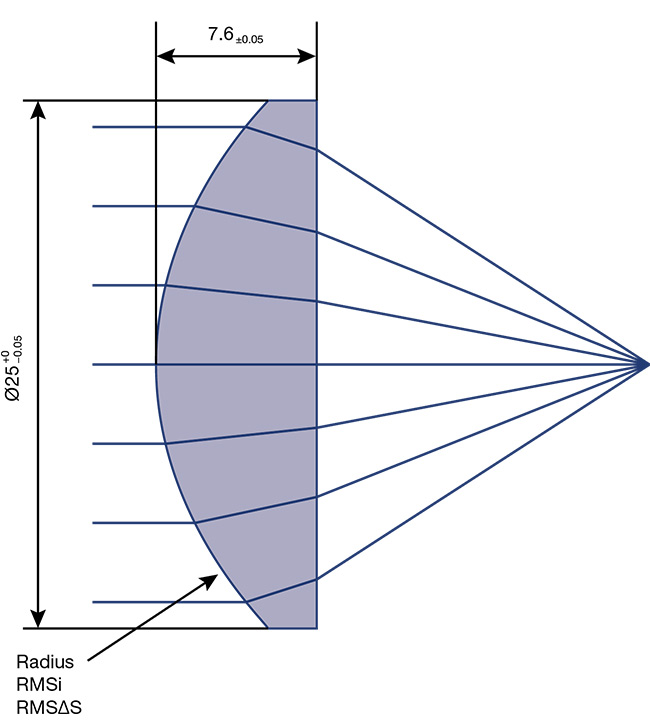
Figure 2. A sketch of the AHL25-20 lens. Courtesy of asphericon GmbH.
The first parameter of interest is the radius of curvature of the AHL25-20 aspheric surface. It has a tolerance of ΔR ±0.5%, which corresponds to
ΔR ±77 µm.
Figure 3 depicts the statistical distribution of the radii achieved for all lenses, where the interval size is ±1 µm. Note that more than half of the lenses are at the nominal value within the measurement accuracy. Also apparent is that less than one-third of the tolerance window is needed. This effect is caused by the deterministic nature of subaperture polishing. The variation in the radius of curvature is caused by variations in the amount of material removed during grinding and polishing, and, of course, by wear in the tool. In optical design tolerancing processes, this behavior can be modeled with either a very slim normal distribution or a Rayleigh distribution.
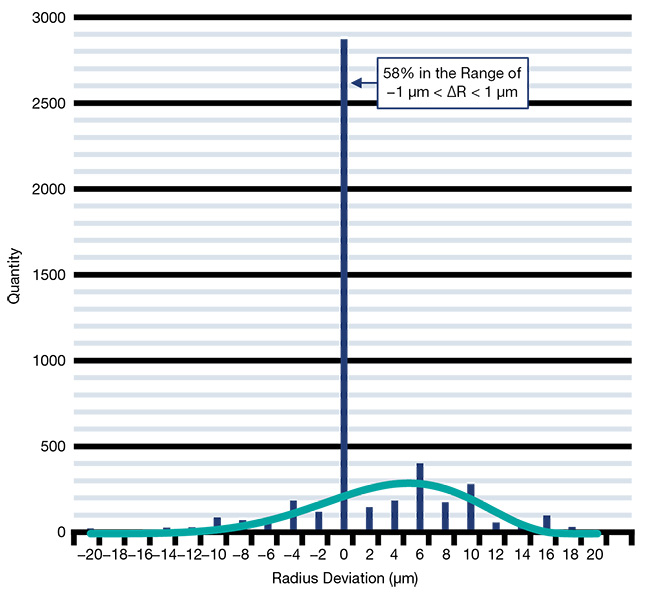
Figure 3. The statistical distribution of the radius of curvature for 4,922 AHL25-20 lenses, as well as a fitted beta function, plus a central peak. Courtesy of asphericon GmbH.
Another parameter of interest is the center thickness, which has a tolerance of ΔD ±50 µm.
Figure 4 shows the complete statistical distribution for all 4,922 lenses, which is very characteristic for center thickness distributions, due to the way these lenses are manufactured.
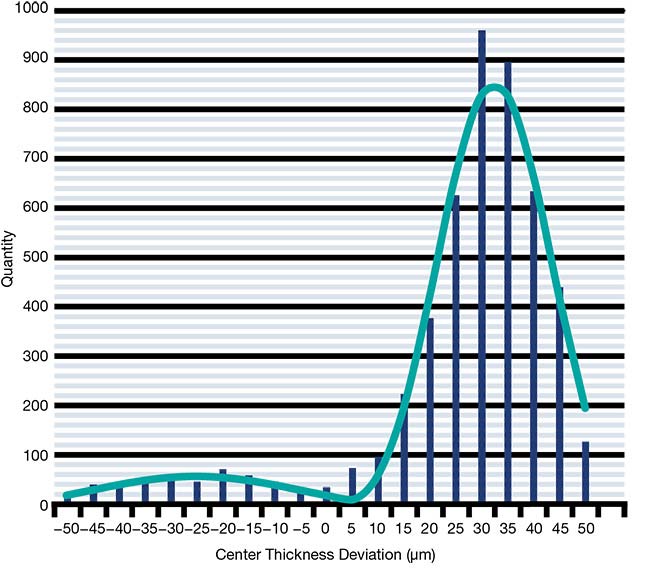
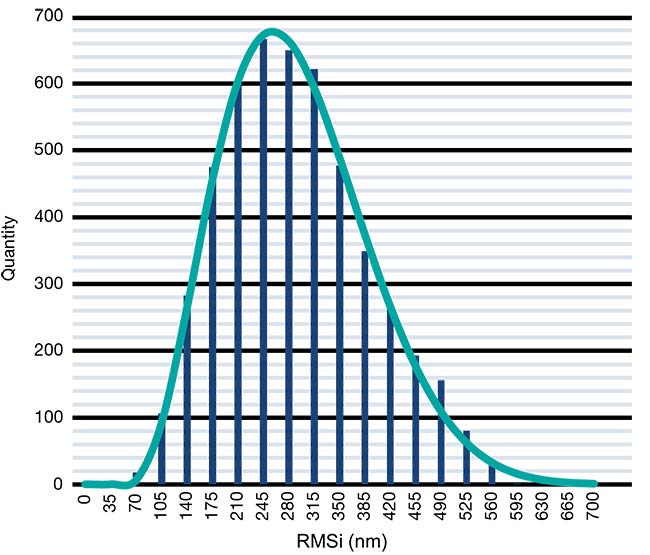
Figure 4. The statistical distribution of the center thickness for 4,922 AHL25-20 lenses, as well as a fitted double-Rayleigh distribution (top). Figure 5. The statistical distribution of the RMSi surface form deviation for 4,922 AHL25-20 lenses, as well as a fitted beta function (bottom). Courtesy of asphericon GmbH.
If the tolerance window is large enough for a second grinding step, then the main peak usually appears in the upper third of the tolerance window. There is a second, much smaller peak that corresponds to a second grinding. The ratio between both peaks also indicates how smoothly the manufacturing process went, although the peak for the second grinding shows that something went differently than planned. The width of both curves corresponds to the different removal rates caused by grinding and polishing, and, again, by wear on the tool.
RMSi surface form deviation
The AHL25-20 aspheric lens has a
given surface form deviation of RMSi <500 nm. Figure 5 shows the statistical distribution for all 4,922 lenses after
polishing, as well as the tolerance limit.
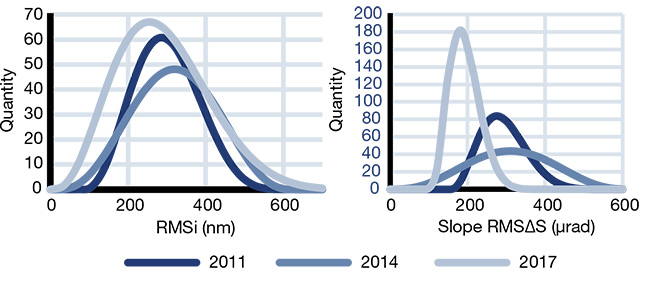
Figure 6. The statistical distribution of the RMSi surface form deviation (left) and the RMS slope (right) for three batches of AHL25-20 aspheres, comprising lenses that were produced and polished
in 2011 (392 lenses), 2014 (400 lenses), and 2017 (562 lenses), and fitted with beta functions. The statistical distributions for the surface shape deviation RMSi look very similar for all three batches. But the RMS slope deviation for each appears unique due to the different polishing processes used during fabrication of the lenses. Courtesy of asphericon GmbH.
The distribution shown is best described as a beta function. What must be kept in mind when putting tolerances on surface form deviation is that, within
the polishing process, this is a cut-off
criterion. In other words, when the desired value is reached, the polishing process is stopped. However, if the value is not quite reached in the first round of polishing, a second run is performed.
Lenses that are polished a second time reach much lower RMSi values. In optical design software, this tolerance is often an endpoint probability distribution — which is a worst-case approximation and can lead to higher costs for larger batches.
RMS slope deviation
Specifying RMS slope deviation offers designers the opportunity to state how the irregularity of an optical surface form deviation should appear. This is especially true for aspheric surfaces, and it is an essential tolerance.
This part of the form deviation was not specified on the lens drawing of the AHL25-20. When analyzed later, however, the distributions of this asphere’s RMS slope deviation — best described as a beta function — were eye-opening.
For deeper insight, Figure 6 depicts three batches of lenses — which were produced in three different years (2011, 2014, and 2017) using different polishing methods — for demonstration purposes. The statistical distributions shown for the surface shape deviation RMSi look very similar for all three batches. But the RMS slope deviation for each appears unique. This is due to the different polishing processes used in the fabrication of the lenses, and it provides a striking example of why quantifying the surface form deviation using the RMS slope deviation is so important1,2.
Figure 6 further suggests that the polishing technique used in 2017 resulted in the least variation in RMS slope deviation and, therefore, provided the most repeatability of all three batches. Such statistics can also provide insight into other factors affecting manufacturing. Employees trained to polish asphericon StockOptics in 2014, for example, found that all the lenses met the specifications on their drawing, but the RMS slope deviation exhibited larger scatter within this batch.
Rounding out
As illustrated above, different lens parameters incur different probability distributions within the manufacturing process. For larger lot sizes, statistical methods can be used to predict probability functions, but these functions must be carefully selected according to the manufacturing process.
In this regard, CNC-based subaperture machining of aspheric surfaces produces distributions not found in classical sphere manufacturing.
Examples were given for radius of curvature, center thickness, and surface shape deviation defined by RMSi and RMS slope. It should be clear that consideration of various statistical distributions can provide insight into the stability of the manufacturing process. In particular, applying RMSi and RMS slope deviation
to define surface shape deviation demonstrates that the second distribution is much more reliable for stable quality output. This is also where the greatest potential lies for using fitted distribution functions. When reliable predictions can be made about the impact that a manufacturing process may have on the expected performance of an optical system, it becomes less necessary to over-specify optical components to compensate for uncertain outcomes — and production costs decline.
Because the aforementioned analyses can precisely identify which parameters
correlate most closely and hold the greatest leverage for improvement, these analyses also form the basis for targeted system improvements in subsequent product iterations. And manufacturers can take all this into account beforehand in optics simulations.
Meet the author
Ulrike Fuchs, Ph.D., is vice president of strategy and innovation at asphericon GmbH. She has authored more than 70 publications and registered six patent families. She was elected as an Optica (formerly OSA) Fellow in 2020; email: [email protected].
References
1. U. Fuchs (2015). Tolerancing aspheric surfaces in optical design. Proc SPIE, Vol. 9582, Optical System Alignment, Tolerancing, and Verification IX, p. 958205.
2. S. Wickenhagen et al. (2017). Tolerancing aspheres based on manufacturing statistics. Optical Design and Fabrication 2017 (Freeform, IODC, OFT), OSA Technical Digest (online), paper ITu1A.2.