Volker Buschmann, Felix Koberling and Andreas Bülter, PicoQuant GmbH
Florescent proteins have opened the possibility to observe protein distribution and localization
by fluorescence microscopy. Directly observing these nanometer-size molecules is
not possible, however. As an alternative, indirect methods such as Förster
resonance energy transfer (FRET) have become very popular.
FRET is a nonradiative process in which energy
from an excited molecule (donor) is transferred to an acceptor molecule, which leads
to changes in the fluorescence intensity and the fluorescence lifetimes of the two
chromophores. The rate of energy transfer is sensitive to the distance between these
two molecules. Hence, this technique can measure intermolecular distances on a nanometer
scale.
In intensity-based microscopy, FRET
can be measured by ratiometric techniques or by acceptor photobleaching. Ratiometric
methods, however, require careful calibration, while acceptor photobleaching can
be performed only once for a given sample. These limitations can be overcome by
measuring the fluorescence lifetime of the FRET-donor using fluorescence lifetime
imaging microscopy (FLIM).
A FLIM-FRET measurement images the
FRET efficiency and therefore visualizes directly the proximity of the donor and
the acceptor molecules. Only the fluorescence lifetime of the donor molecule, which
is concentration-independent, is used as a probe. The FRET process can be identified
by a decrease of the fluorescence lifetime (quenching) of the donor in comparison
with the lifetime of the individual molecule as a result of the energy transfer
to the acceptor molecule.
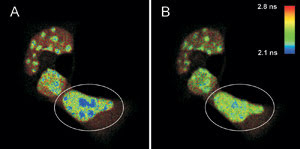
FLIM-FRET measurements of live mouse adipocyte cells transfected
with CFPF46L, A206K-C/EBPa DBD and YFPF46L, A206K-C/EBPa DBD were
imaged before (A) and after photobleaching (B) of the FRET-acceptor YFP in the cell
indicated by the white circle. The donor fluorescence originating from CFP is shown,
and the fluorescence lifetime is indicated by the false-color representation.
As an example, we used FLIM to visualize
the dimerization process of the CCAAT/enhancer binding protein alpha (C/EBPα),
with samples provided by Richard N. Day and Amnasi Periasami of the University of
Virginia in Charlottesville. The C/EBP family plays a key role in developmental
gene expression. C/EBPα is known to form obligate dimers and to bind to certain
regions of pericentric heterochromatin in mouse adipocyte cells. To visualize the
distribution and dimerization of C/EBFα, mouse adipote cells were transfected
with plasmids encoding the DNA binding domain of C/EBFα tagged with CFP and
YFP. The dimerization of the proteins can be identified by the FRET process between
them, which in turn leads to a decreased lifetime of CFP in comparison with a sample
without YFP staining.
FLIM images of the live cells were
taken using an Olympus FluoView 1000 upgraded to FLIM and fluorescence correlation
spectroscopy capabilities with a dedicated kit from PicoQuant GmbH. The Upgrade
Kit uses a pulsed picosecond diode laser emitting at 440 nm, a single-photon avalanche
photodiode and a time-correlated single-photon counting board.
The measurement principle is based
on the precise measurement of the time difference between the moment of excitation
and the arrival of the first fluorescence photon at the detector. This measurement
is repeated several million times to account for the statistical nature of fluorescence
emission, and all measured time differences are sorted into a histogram. This histogram
can be analyzed to extract the fluorescence lifetime and signal amplitude for every
pixel.
The figure shows a FLIM image of a
heterogeneous cell stained with CFP-C/EBPα DNA binding domain; the areas with
high signal intensity are pericentric heterochromatin regions (A), and the FRET
process can be identified in the blue areas. The lifetime of CFP is shorter than
that of a sample without YFP staining, which was found to be 2.4 ns on average.
To prove this, YFP was photobleached in the marked area in A by a 514-nm CW laser.
After the photobleaching (B), the pixels corresponding to a fluorescence lifetime
of less than 2.2 ns are greatly reduced, while the fluorescence lifetime in other
cellular regions is unaffected.
The average lifetime distribution of
the acceptor bleached cell becomes much more uniform, as shorter components mainly
disappear, indicating that shorter measured average CFP-lifetimes in pericentric
heterochromatin have been caused by FRET.
A further analysis of these images
yields the FRET efficiency as well as the distance between the donor and the acceptor
molecule.
Meet the authors
Volker Buschmann is senior scientist for microscopy,
Felix Koberling is head of the microscopy group and Andreas Bülter, in sales
and marketing at PicoQuant GmbH, Berlin; e-mail: [email protected].