
Dyeless Method Maps Blood Flow in Brain Down to Single Cell
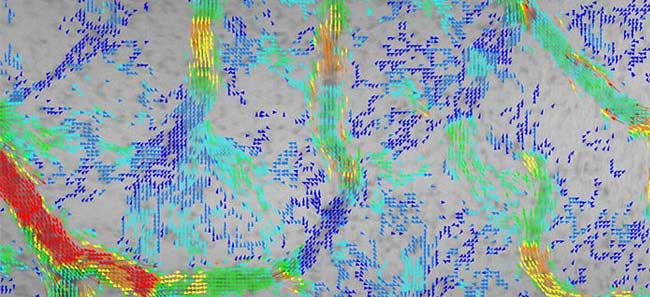
Red blood cell velocity distribution measured and mapped via the new method devised by the Skoltech-SSU team. Each arrowhead corresponds to one cell, with the velocity color-coded from blue (slow) through green (moderate) to red (fast). Courtesy of Maxim Kurochkin/Skoltech.
Researchers from the Skolkovo Institute of Science and Technology (Skoltech) and Saratov State University developed an inexpensive method of visualizing blood flow in the brain, one that avoids the need for dyes and/or genetic engineering. The technique is precise enough to discern the motions of individual red blood cells.
One highly precise technique used to map the brain’s blood vessel network, which helps understand how the brain’s blood supply works, involves injecting fluorescent dyes into the blood flow and detecting the infrared light they emit. Dyes are toxic, however, and they also may distort mapping results by affecting the vessels.
Alternatively, researchers employ genetically modified animals, whose interior lining of blood vessels is engineered to give off light with no foreign substances involved.
Both methods are expensive to perform.
The Skoltech technique integrates optical microscopy and image processing, and is very fine-grained, owing to its ability to detect every blood cell traveling along a blood vessel.
“Our method uses what’s known as frame-by-frame filtering to process brain images obtained with an ordinary optical microscope available at any lab,” said Skoltech research scientist Maxim Kurochkin, lead author of the study. “It allows us to discern single moving red blood cells and build a highly detailed map of the vasculature, down to the smallest capillaries. This in turn makes it possible to accurately assess blood flow rates in the vessels via a technique called particle image velocimetry.”
The team showed the method’s applicability using two biological models: the mouse brain and the chicken embryo. First the researchers used the vascular networks of the chicken embryo to demonstrate the possibility of mapping even the tiniest capillaries, in which red blood cell motions may be inconstant. After that, they tested the method on a more complex model: rat brain vasculature. The technique proved capable of mapping blood vessel networks even for a system with vessels that are harder to reach, with no individual RBCs discernible, only the color patterns associated with groups of vessels.
Characteristics directly provided by the method are blood flow rate and vessel diameter.
“But once you have that, you can try and extract more information: vessel elasticity, membrane stiffness, blood pressure, and viscosity,” Kurochkin explained. “Physiologists building on our work can use these parameters to create blood circulation models, testable against experimental measurements from pressure and viscosity sensors, for example.”
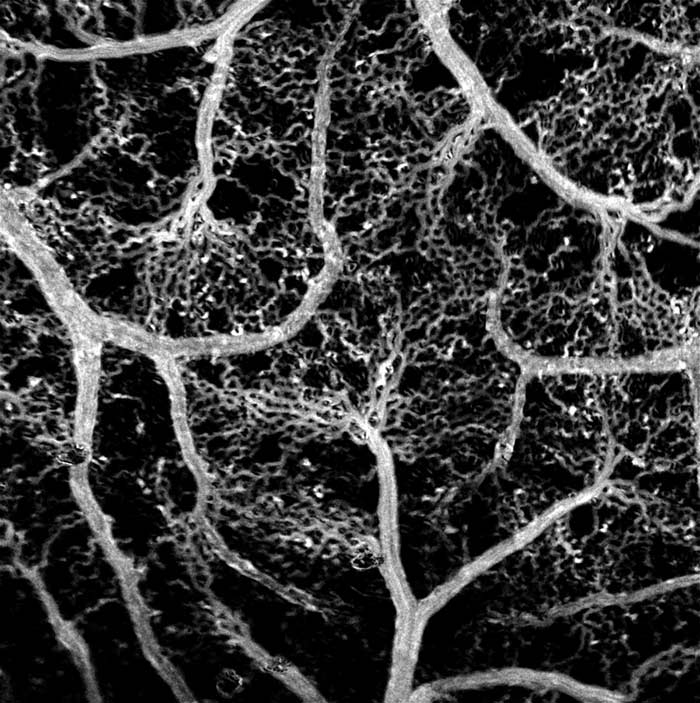
A reconstructed map of the blood vessel network in a chicken embryo obtained by adaptive frame-by-frame threshold filtering of a series of images of moving red blood cells. Courtesy of Maxim Kurochkin/Skoltech.
The technology will lead to a better understanding of the physiology of endothelial cells, which line the interior of blood vessels, the researchers said. The state of endothelial cells is tied to cardiovascular diseases, which are the leading cause of death globally.
A hemorrhagic stroke, for example, happens due to blood vessel thinning and rupture in the brain — specifically, when a weak spot in a vessel wall balloons into what’s known as an aneurysm. “An accurate vasculature model could tell you just how much thinning of a vessel’s wall causes it to break,” Kurochkin said.
Blood vessel health is indirectly involved in diseases of different nature, too. The visualization method could be applied to study tumors, which consume abnormally high amounts of nutrients and therefore tend to develop a lot of blood vessels. A further example, from among infectious diseases, is malaria, in which blood viscosity becomes elevated.
“In targeted drug delivery, artificial microcapsules with therapeutic agents may be introduced into the bloodstream, and vasculature models are indispensable for predicting exactly what happens to them there,” Kurochkin said.
The research was published in The European Physical Journal Plus (www.doi.org/10.1140/epjp/s13360-021-01700-9).
Published: September 2021