By spectroscopically measuring temporal fluctuations of scattered light, clinicians can predict the progression of diseases that manifest in molecular changes in the eyes.
JEFFREY N. WEISS, MICRON OPHTHALMIC INC.
The early detection of neurologic damage caused by Alzheimer’s disease, before symptoms have appeared, is integral to the development of effective treatments. Early detection, made possible by leveraging dynamic light scattering to identify subtle cellular changes, could facilitate intervention that might prevent progression of the disease. It could even help plot a successful treatment. This technology could not only offer data leading to an early diagnosis of the condition but also help determine drug efficacy at an earlier stage of the disease. And beginning a regimen as soon as possible would shorten the length of drug studies, reducing the associated research costs.

Illustration of Alzheimer’s disease research. Courtesy of iStock.com/kirstypargeter.
Alzheimer’s is a slowly progressive disease caused by physical changes in the brain that result in the loss of mental abilities and memory. Unfortunately, no simple clinical test exists to diagnose the condition in a living patient. The definitive diagnosis is made posthumously during an autopsy through the discovery of protein fragment beta-amyloid plaques and twisted strands (tangles) of the protein tau. Each causes nerve cell damage and death.
The average life expectancy following the presumed diagnosis is five to 10 years. No successful treatment has been identified to date, although in some cases, pharmaceuticals may alleviate symptoms such as confusion, memory loss, and anxiety.
During the last 15 years, more than 500 clinical trials of therapeutic agents for Alzheimer’s disease have been registered with the National Institutes of Health website ClinicalTrials.gov. For trials with reported results, the failure rate has been almost 100% in slowing or stopping the disease’s progression. Though most clinical trials typically have lasted 1.5 to three years, a study duration of five to 10 years may be required to detect a long-term benefit by medical standards.
Answers found in the eyes
The eye is the only place in the body where an artery, vein, and nerve can be directly imaged together, with specialized instrumentation. Since the nerve fiber layer of the retina is an outgrowth of the brain, the retina can provide vital clues in the diagnosis of Alzheimer’s disease.
For example, images created using optical coherence tomography (OCT) (Figure 1) have demonstrated the thinning of the retinal nerve fiber and retinal ganglion cell layer in patients diagnosed with Alzheimer’s disease. It is apparent that a change at the molecular level must lead to changes that become visible in later images.
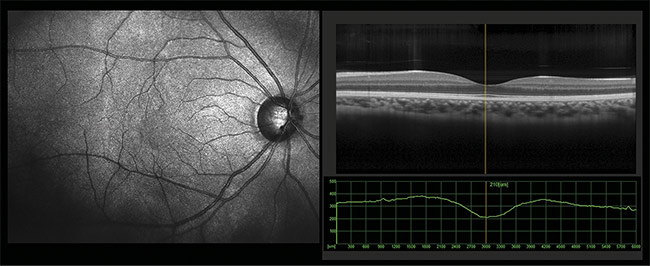
Figure 1. A view of the fundus of an eye showing the optic nerve, macula, and retinal vessels (left). A cross-sectional view of the eye obtained via optical
coherence tomography (OCT) (right). Courtesy of iStock.com/yogenyogeny.
Light scattering
When a light beam hits a particle, there is a transfer of energy such that light travels in all directions. The incident beam loses power. An observer can see the scattered light. If there were no scattering, the light beam would appear invisible to the observer. The power of the scattering medium is expressed as turbidity.
Dynamic light-scattering (DLS) spectroscopy1 — also known as photon correlation spectroscopy, quasi-elastic light-scattering spectroscopy, or laser light-scattering spectroscopy — measures the random thermal movement (a phenomenon known as Brownian motion) of particles in a solution by using laser light to analyze the temporal fluctuations of scattered light intensity. This presents the opportunity to capture molecular changes that are indicative of a particular disease or treatment earlier than they could be captured by other imaging methods.
The random motion of proteins causes localized changes in particle concentration, which affects the intensity of scattered light.
The scattered light intensity I(t) is compared to the scattered light intensity at a later time, which is measured as a time correlation using the following formula:
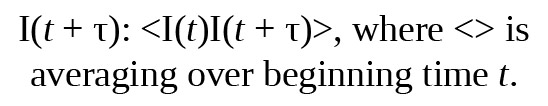
Scattered wave interference in the far-field region generates a net scattered light intensity I(t), which displays stochastic fluctuations, depending on whether the interference is constructive or destructive, due to the random motion undergone by suspended particles. The DLS correlation curve assumes that each detected photon has been scattered once.
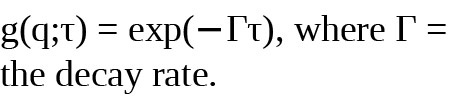
There is a high correlation between the signal and short time delays, as the signals are unchanged because the particles do not have a chance to move significantly between the light source and the detector. With a longer time delay, the correlation will decay exponentially. A monodisperse sample (one with particles of a uniform size) will exhibit a single exponential decay. This pattern is captured in the following equation:
The translational diffusion coefficient Dt may be derived at a single angle or at a range of angles, depending on the wave vector q:
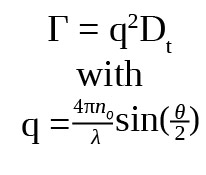
where λ is the incident laser wavelength, n0 is the sample’s refractive index, and θ is the angle at which the detector is located with respect to the sample.
Small spherical particles do not demonstrate angular dependence or anisotropy. Nonspherical particles demonstrate angular dependence and anisotropy. An optimal angle of detection exists for each particle size. This is important in a polydisperse sample with an unknown particle size distribution. The autocorrelation function is a sum of the exponential decays corresponding to each species in the population. From this calculation, the state of decay of various cellular components can be determined.
Historically, DLS has been used to predict the development of cataracts in rabbits2, the development of cataract formation and diabetes mellitus in humans3,4 the effectiveness of treatment for wet age-related macular degeneration5, and the success of retinal stem cell surgery6. The results have demonstrated the utility of DLS to noninvasively quantitate subtle changes at the molecular level.
A new proof-of-concept instrument for making retinal measurements has been developed (Figure 2). The light source provides optical power below the maximal permissible exposure recommended by the ANSI Z136.1 (2014) standard. The minimal amount of light (<10 µW) necessary to make a 5-s measurement can be used. The detector is interfaced with a standard clinical fundus camera. Scattered light is analyzed by a digital autocorrelator with an extended delay option for baseline determination. The intensity fluctuations are averaged over 5 s, and the cumulant analysis method is used to analyze light-scattering data — including average hydrodynamic particle size, diffusion coefficient, decay times, and polydispersity factors — as a function of the sample time.
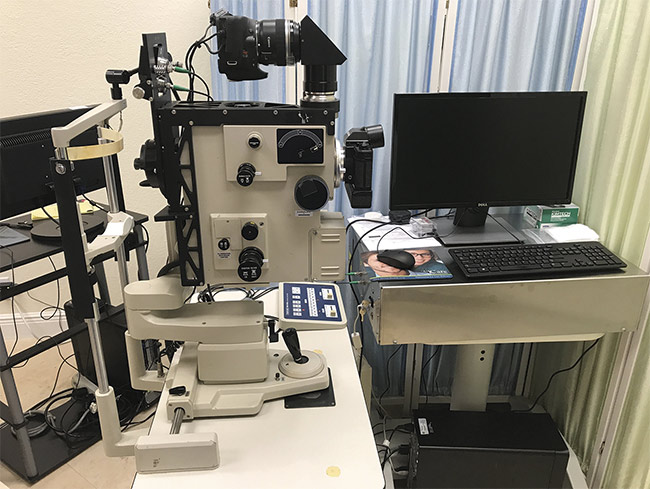
Figure 2. A prototype of a new dynamic light-scattering (DLS) device. Courtesy of Jeffrey N. Weiss.
The instrument was used to test the eyes of 17 patients who had no history of neurologic disease. No significant differences were seen between the left and the right eyes in patients with normal eye examinations. In addition, the results, taken over a six-month time span, were not significantly different, demonstrating a reproducibility and consistency of baseline measurements.
Measurements were made at 12.5-, 200-, 400-, 800-, 1600-, and 3200-ns sample times. The best-fit measurements, where collected data could best be approximated, were seen at the 12.5- and 200-ns sample times. This finding was confirmed in all cohorts tested.
DLS measurements were then made from the macular area of 15 patients diagnosed with possible or early Alzheimer’s disease (Figures 3 and 4) and from a control group of 15 patients of similar ages with no history of neurologic disease and with normal retinal examinations. To remove the effect of any local retinal pathology on the DLS measurements, such as diabetic macular edema or age-related macular degeneration, measurements were also made from five patients at the optic nerve. This proof of concept demonstrated results that were similar to those taken from the normal retina. An advantage of optic nerve versus retinal measurements would be that a retinal examination would no longer be required.
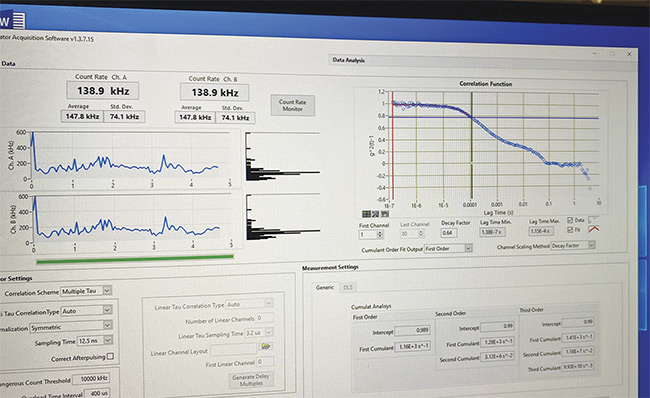
Figure 3. A screenshot of a DLS measurement of a 62-year-old female diagnosed with Alzheimer’s disease. Courtesy of Jeffrey N. Weiss.
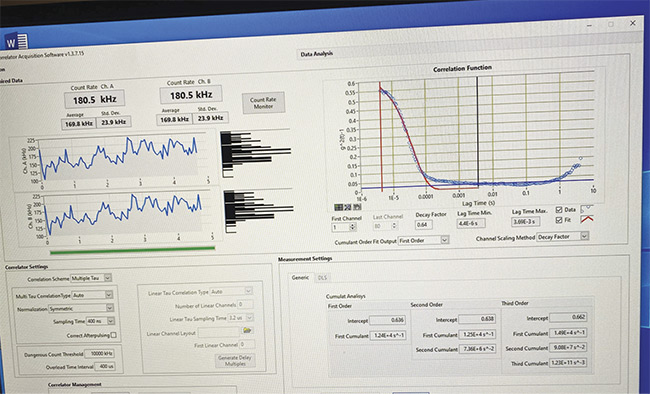
Figure 4. A screenshot of a DLS measurement of an age-matched control patient with no Alzheimer’s symptoms. Courtesy of Jeffrey N. Weiss.
The difference seen between patients diagnosed with Alzheimer’s disease, as compared to an age-matched control, is consistent across the tested patients. Alzheimer’s measurements consistently begin above 0.6 g2(t)-1 and exhibit flattening of the initial line, representing significant changes in the structure of the eye, as opposed to the curve seen in non-Alzheimer’s patients.
A large study is necessary to confirm these findings. An early, noninvasive, quantitative test to diagnose Alzheimer’s disease has the potential to provide a wider window of treatment, leading to breakthroughs in drug development and, hopefully, to the alleviation of patients’ dementia before it is irreversible.
Meet the author
Jeffrey N. Weiss, M.D., is president of Micron Ophthalmic Inc. He is former chief of retinal surgery at the Joslin Diabetes Center in Boston, a faculty member of Harvard Medical School, and a visiting scientist at the Massa-
chusetts Institute of Technology. Weiss is the author of Dynamic Light Scattering Spectroscopy of the Human Eye; email: [email protected].
References
1. J.N. Weiss (2022). Dynamic Light Scattering Spectroscopy of the Human Eye. Springer Press.
2. I. Nishio et al. (1984). In-vivo observation of lens protein diffusivity in normal and
x-irradiated rabbit lenses. Exp Eye Res,
Vol. 39, pp. 61-68.
3. J.N. Weiss et al. (1984). Laser light scattering spectroscopy of in-vivo human lenses. Invest Ophthalmol Vis Sci, Vol. 25,
pp. 594-598.
4. S.E. Bursell et al. (1989). Clinical photon correlation spectroscopy evaluation of human diabetic lenses. Exp Eye Res, Vol. 49, pp. 241-258.
5. J.N. Weiss (2013). Dynamic light scattering technique shows potential in measuring effects of AMD treatment. Ocular Surgery News, Retinal Ed., Vol. 31, No. 8, p. 57.
6. J.N. Weiss and S. Levy (2019). Dynamic light scattering spectroscopy of the retina — a non-invasive quantitative technique to objectively document visual improvement following ocular stem cell treatment. Stem Cell Investig, Vol. 6, p. 8, www.doi.org/10.21037/sci.2019.03.01.