Fluorescence spectroscopy is used routinely to analyze all types of luminescent samples, from solid materials for semiconductor devices to fluorescent probes for medical imaging. And in a mixture of many fluorescent compounds, it is possible to identify each one by its combination of excitation and emission wavelengths.
MARIA TESA, EDINBURGH INSTRUMENTS
Excitation-emission fluorescence spectroscopy (EEF) is particularly interesting in materials characterization, environmental science and the food industry. For example, the user can quantify multiple emitting sites in rare-earth doped crystals1 or different types of carbon nanotube structures in a mixture2. This technique is also used to obtain the fingerprint of food samples3, study bacterial activity in environmental samples or characterize the organic matter content in water4.
The spectral fingerprint of a fluorescent compound mixture is provided by its excitation-emission map (EEM), containing both qualitative and quantitative information on the sample. In particular, the use of EEMs to study polyaromatic hydrocarbon content in water is widely popular5.
EEMs are traditionally acquired with commercial fluorescence spectrometers based on detection by photomultiplier tubes (PMTs). The instruments typically have a broadband excitation source and monochromators on both the excitation and emission channels (Figure 1).
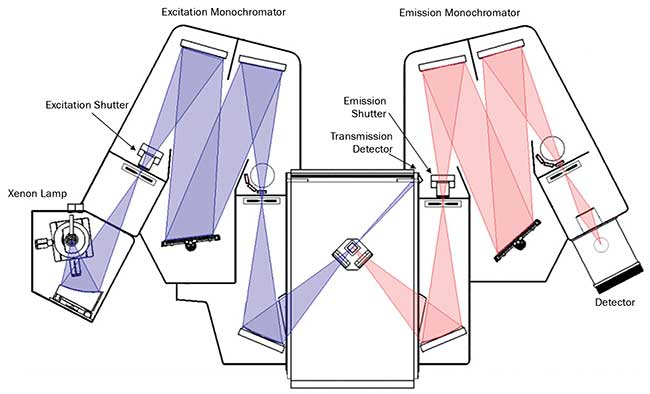
Figure 1. Schematic of a photomultiplier tube (PMT)-based fluorescence spectrometer. Courtesy of Edinburgh Instruments.
To acquire an EEM, the excitation wavelength is fixed, while the emission wavelength is scanned across the desired range. Once the scan across the emission range is finished, the excitation monochromator moves to the next wavelength and a new emission spectrum is acquired. This process is repeated until the end of the excitation range, and a 3D map is built with wavelengths in the XY coordinates and fluorescence intensity in the Z coordinate (Figure 2).
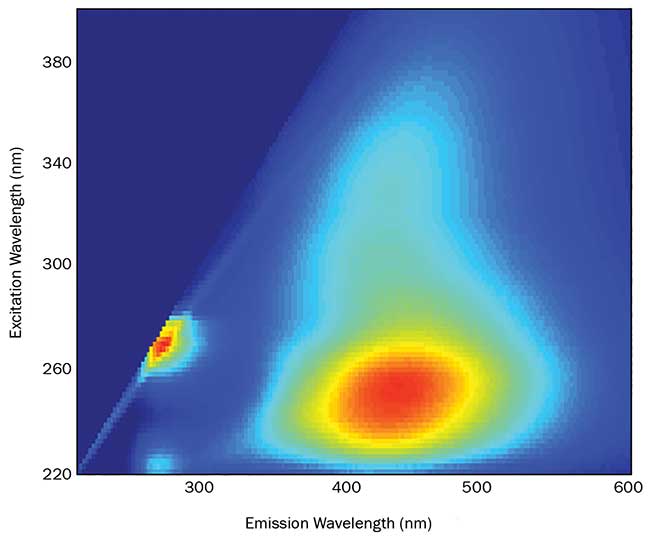
Figure 2. Excitation-emission map (EEM) of a water sample with fluorescence intensity plotted in a color scale. The EEM was acquired in a PMT-based spectrometer over five hours. Courtesy of Edinburgh Instruments.
PMT-based instruments have the advantage of photon-counting sensitivity. However, scanning both monochromators results in long acquisition times, whereas a well-resolved EEM may need only several hours of acquisition. This approach is not feasible for rapid screening of multiple samples, which is a basic requirement for quality control in industry or for research studies involving many samples. In addition, it is not possible to acquire reliable EEMs over such long periods if the sample is not photostable.
Challenges of photobleaching
Every fluorescent sample can potentially be damaged by excitation light, reducing its fluorescence intensity. This effect is known as photobleaching, and over time it appears as a decrease in the observed signal. The photostability of an analyte is often affected by its chemical environment and is not always easy to predict; a different solvent or the presence of oxygen can have a dramatic impact on it.
Photobleaching is a particularly important problem in microscopy because of the high power densities that arise from a focused excitation beam, so it is crucial to choose photostable fluorophores in imaging studies. Photobleaching is also observed with monochromator-based instruments, especially with biological samples or light-sensitive chemicals.
When photobleaching is observed in fluorescence spectroscopy, an obvious solution is to reduce the power of the excitation source, thereby slowing down the photodegradation process. This approach is not suitable for samples with low fluorescence quantum yield, as the signal may drop below the detection limit of the instrument. If working with liquids, it is possible to use mechanical stirring or circulation of the sample, which continually refreshes the solution exposed to the excitation beam. This is not always possible, as it requires a relatively large volume of a sample.
One way to reduce the effect of photodegradation that is suitable for all kinds of samples is to decrease the measurement time. When dealing with unstable samples, it is desirable to complete the EEM measurement before photodegradation begins to affect the results. But in many cases, an hour-long measurement is not sufficient.
CCD solution
The acquisition time of EEMs can be drastically reduced by using a different instrument configuration. CCD detectors offer an excellent solution to this problem, demonstrated by the increasing number of commercial CCD-based fluorometers or CCD detector add-on options. These devices acquire a full emission spectrum in one shot, eliminating the need to scan the emission monochromator and, in turn, greatly reducing acquisition time, typically from hours to minutes (Figure 3).
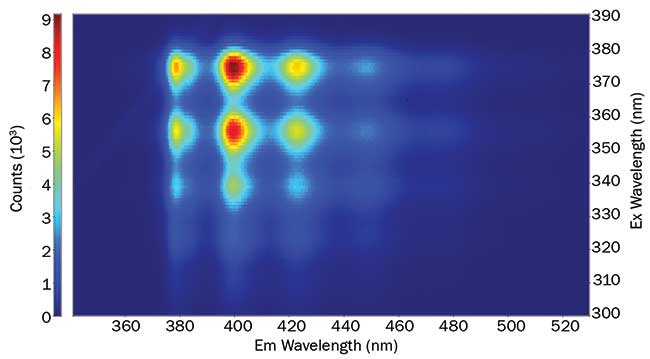
Figure 3. An EEM of anthracene in cyclohexane, acquired in a fluorescence spectrometer equipped with a CCD. The map was acquired in 15 minutes. An EEM with the same resolution could take over 10 hours in a PMT-based instrument.
Courtesy of Edinburgh Instruments.
A CCD detector contains an array of photosensors that enables the detection of light with spatial resolution. The array comprises pixels of a photoactive material arranged in columns and rows. When a photon falls on a pixel, it creates a charge that is shifted row by row and transferred to the readout register.
CCD detectors are mounted on the emission monochromator of the fluorescence spectrometer in the same fashion as PMTs (Figure 4). The difference: A PMT detector is a point detector that utilizes a slit and exposes one emission wavelength at a time, while the CCD requires imaging of its entire sensor area — typically a few centimeters — at one time. Therefore, a wide aperture remains in front of the CCD detector. The emission light is imaged onto the CCD area with the wavelength set by the monochromator in the center and the rest of the spectrum distributed vertically to the sides. Each vertical pixel array of the sensor corresponds to a wavelength with a resolution determined by the groove density of the monochromator grating and the pixel size of the CCD.
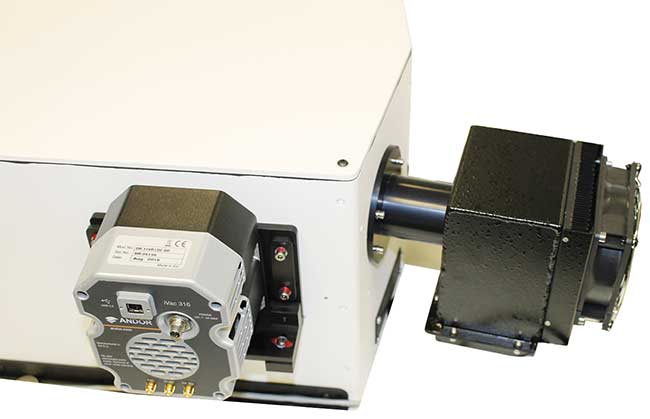
Figure 4. PMT and CCD detectors on a fluorescence spectrometer. Courtesy of Edinburgh Instruments.
Since vertical resolution is not important here, CCD cameras in spectrometers operate in binning mode rather than single pixel readout. The summed charge for each vertical array gets readout in one register, improving the signal-to-noise ratio. Often, a full spectrum of high quality can be acquired with a single shot of the camera.
Aside from optical design, a CCD detector is the decisive factor affecting the performance of the instrument. For more demanding research applications, it is possible to incorporate high-quality CCDs into modular fluorescence spectrometers. Such systems can be customized.
Navigating CCD specifications can be dazzling for nonspecialists. However, there are a few basic concepts that provide a starting point. An important consideration is detector sensitivity, which is usually defined as the signal-to-noise ratio. Sensitivity depends on both the quantum efficiency (QE) — the ratio of converted electrons per incident photons — and the noise specification of the detector. Although it can easily reach 0.9 at the peak wavelength, it decays steeply at the edges of the detection range. The spectral QE curve of the CCD should be studied, ensuring that it is sufficiently high for all wavelengths of interest.
The noise specification of the camera is often the limiting factor with sensitivity, especially in fluorescence, as it is a low light level application. Two main types of noise affect CCD performance — read noise and shot noise. The latter is intrinsic Poissonian noise on the image arising from the quantized nature of the incident light. Read noise results from operation of the CCD camera and comprises many different processes.
The main contributors are dark current (i.e., thermal generation of charges in the sensor) and the readout noise of the electronics. Readout noise is often dominant, but dark noise can be a problem when long exposure times are used. This is often the case in fluorescence spectroscopy. Dark noise can be reduced by cooling the detector with either air or water circulation. However, the lowest temperature will not always be the optimal one. Quantum efficiency may decrease with temperature, especially in the near-infrared.
The resolution of the system should be matched to the application. For example, rare-earth materials have narrow emission linewidths and are extremely demanding in terms of resolution. In contrast, large organic molecules show broad emission bands and do not require high spectral resolution. Resolution depends on both monochromator grating and CCD pixel size.
A high grating groove density offers better resolution, although a narrower section of the spectrum will be covered in one shot. In this case, different emission wavelengths may be needed to cover the entire range. For example, a CCD detector with 1000 vertical pixel arrays and a grating with a density of 100 grooves/mm could be used, providing coverage of 500 nm in one shot with a resolution of 0.5 nm/pixel. If the monochromator’s grating is changed to 1000 grooves/mm, a 0.05-nm/pixel resolution is achieved, but only 50 nm will be acquired in one shot.
A smaller CCD pixel size provides better resolution, but less dynamic range; for a CCD, the dynamic range represents the ratio of full well capacity to noise, where full well capacity is the maximum achievable signal for a pixel before saturation takes place. If the well depth of a CCD is low, it will saturate easily, although this is usually not a problem in low light level applications.
The aforementioned parameters can assist in choosing a CCD detector for a fluorescence spectrometer. It should be considered that PMT-based instruments provide better sensitivity and resolution, and are generally a better option unless fast measurements are required. An instrument with several detector channels allows rapid switching between these two options, providing access to the benefits of both detectors — PMTs can be used for challenging samples, while CCDs can be used for fast EEMs of unstable compounds. The measurement speed of the CCD spectrograph can be useful for other types of measurements as well, such as reaction kinetics studies, which often require obtaining a spectrum within milliseconds.
Meet the author
Maria Tesa is an applications and product specialist at Edinburgh Instruments in Scotland, providing technical sales support of fluorescence spectrometers, transient absorption spectrometers, and lasers for both industry and academia; email: [email protected].
References
1. V. Dierolf et al. (2000). High-resolution site selective optical spectroscopy of rare earth and transition metal defects in insulators. J Lumin, Vol. 87–89, pp. 989-991.
2. G. Arnaoutakis and A. Gakamsky, Edinburgh Instruments. (2015). Excitation-emission spectroscopy of single wall carbon nanotubes. Edinburgh Instruments Application Note.
3. G. Arnaoutakis, Edinburgh Instruments. (2015). Fluorescence spectroscopy of wine. Edinburgh Instruments Application Note.
4. G. Arnaoutakis et al., Edinburgh Instruments. (2016). Water quality by monitoring the natural organic matter of aquatic systems. Edinburgh Instruments Application Note.
5. Á. Andrade-Eiroa et al. (2012). Environmental applications of excitation-emission spectrofluorimetry: An in-depth review II. Appl Spectrosc Rev, Vol. 48, Issue 2.