New technology is helping flow cytometry perform better — and even in vivo — cell analysis.
Hank Hogan, Contributing Editor
When it comes to counting, examining and sorting cells in a moving
fluid stream, researchers are not content to go with the flow. They are constantly
looking for ways to improve the flow cytometers that are used for these tasks. In
a flow cytometer, a fluid stream that carries particles or cells is hydrodynamically
focused into a small volume and then interrogated, often optically. From these readings,
researchers deduce cell characteristics.
Three recent innovations promise improvements
for different parts of the process. One delivers better fluid focusing through changes
in chamber design. Another offers better multispectral analysis through the use
of quantum dots — nanometer-size semiconductor crystals whose fluorescence
is narrow, stable and size-dependent. The third combines fluorescence imaging with
cell population information in a live animal.
Tiny devices, focused results
Commercial flow cytometers tend to be sophisticated
and expensive, and they require large sample volumes. At the University of California,
San Diego, postdoctoral researcher Claire Simonnet and assistant physics professor
Alex Groisman have demonstrated a different approach — a microfluidic cytometer.
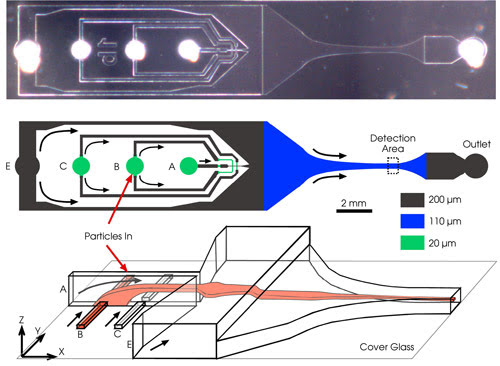
In this high-throughput microfluidic flow cytometry device,
arrows show the direction of fluid flow. The top image shows a micrograph of the
device from above. The middle shows a schematic of the microchannel network, with
the dashed box indicating the cytometry channel. A suspension of particles is injected
into port B; flow focusing is provided by the liquids injected into ports A and
C (focusing from top and bottom), along with liquid injected into port E. Port F
is the outlet. The channels are a few hundred microns deep and of similar width.
The schematic diagram on the bottom shows the structure of the flow in the device,
from the 3-D focusing element to the cytometry channel. The liquid injected in inlet
port B is dark in color. Image courtesy of Alex Groisman.
Microfluidic devices are small and
inexpensive, suitable for lab-on-a-chip and one-time-use applications, but, to date,
microfluidic cytometry chambers have lacked something, according to Groisman; namely,
3-D flow focusing.
Without tight flow focusing, cell velocities
tend to vary a lot. The stream of particles spreads out, making optical detection
difficult and correction necessary. The researchers, therefore, set out to modify
the flow chamber and to improve the fluid focusing.
They worked with poly(dimethylsiloxane)
(PDMS), a transparent rubber. Using soft lithography fabrication, they fashioned
the rubber into two devices capped by cover glass. One device was intended for high
throughput, while the other was for high-resolution applications. Each had inlet
and outlet ports, with connecting channels in the PDMS. One inlet was for injecting
a particle-bearing fluid, while the others were for injecting focusing fluids.
Both devices had 110-μm-deep cytometry
channels, some of which were 200 μm wide, 200 μm deep and 6 mm long, while
others were 120 μm wide, 400 μm long and 8 μm deep. Others had other
dimensions. Viewed from above, the devices appeared to be a series of intersecting
channels.
Simonnet noted a bit of trial and error
in determining the layout and size of the channels. “We have made a number
of iterations to optimize the 3-D flow focusing and to enhance the performance,”
she said.
An important part of getting the fluid
flow right, she continued, was the use of hydrostatic pressure. That approach ensured
a stable forcing pressure, guaranteeing stable flows.
For high-resolution imaging, the researchers
used a Nikon inverted fluorescence microscope equipped with a standard mechanical
stage and a 60x objective. They attached a Diagnostic Instruments Inc. cooled
camera with a 1360 x 1024-pixel CCD and a maximum rate of 10 fps to the microscope.
For high-throughput fluorescence detection, they used a Hamamatsu photomultiplier
tube with a 488-nm-wavelength emission from an argon-ion laser for a light source.
They focused the beam down to a 12-μm spot using microscope optics.
In a series of experiments, they verified
device performance. For the high-throughput device, they injected three types of
2.5-μm polystyrene beads, with nominal relative fluorescence intensities ranging
from 100 down to 2.6 percent. They varied the inlet pressure and demonstrated detection
rates of up to 17,000 particles per second. The work is detailed in the Aug. 15
issue of Analytical Chemistry.
At the time these experiments were
done, noise arising from the electronics would have kept the device from working
with fluorescently marked live cells. Groisman reported improvement of the signal-to-noise
ratio but no testing yet with live cells.
For the high-resolution device, the
researchers moved the microscope stage at 0.60 mm per second over 300 μm so
that moving particles and cells in the device appeared stationary. Using exposure
times of up to 100 ms over a field of view spanning 146 x 110 μm, they took
images of polystyrene beads and yeast cells. These pictures did not show any streaks
or blurring and were comparable with still micrographs.
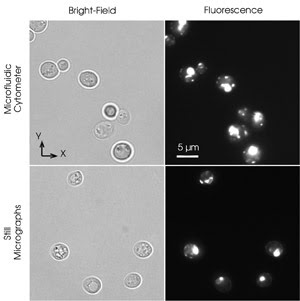
Fluorescently labeled yeast cells were focused to a thin
flow layer in a high-resolution microfluidic flow cytometer. The cells were moving
at a velocity of 0.57 mm/s. Researchers at the University of California, San Diego,
moved the microscope stage with the same velocity in the opposite direction and
took the images under bright-field illumination with a 1-ms exposure (top left)
and under fluorescence illumination with a 100-ms exposure (top right). The cells
are not blurred, indicating smooth flow in the cytometer and no rotation. Images
of similarly labeled cells immobilized on a substrate were taken under bright-field
illumination with a 1-ms exposure (bottom left) and under fluorescence illumination
with a 100-ms exposure (bottom right). The still images and those from the cytometer
appear equally sharp. Images courtesy of Alex Groisman, University of California,
San Diego.
To use the device for mammalian cells
will require scaling it up roughly 2.5 times to accommodate up to 15-μm-diameter
cells. Groisman said it would not be necessary to expand the already relatively
long stable flow region by a similar amount; instead, a more powerful light source,
different optics, another camera, a slower flow rate or some combination of these
could be used. “All we need is enough photons of the fluorescent light from
cells,” he noted.
A different path to better flow cytometry
was taken by a team that included researchers from the National Institutes of Health
in Bethesda, Md., Solus Biosystems of Palo Alto, Calif., the University of Pennsylvania
in Philadelphia, John Radcliffe Hospital in Oxford, UK, the University of Alabama
at Birmingham, the University of Washington in Seattle and Carnegie Mellon University
in Pittsburgh. The group improved the cytometer’s ability to characterize
cells by labeling them with quantum dots. By adding these to more traditional labeling
techniques, they resolved 17 fluorescence colors.
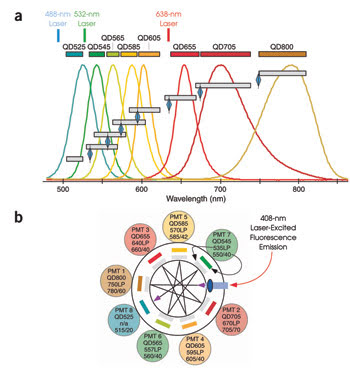
Certain aspects of quantum dots make multicolor detection easier. The emission spectra (colored
lines) of various quantum dots range from blue to red (a). Emission is narrow and
symmetrical, allowing long-pass dichroic filters (blue diamonds) and bandpass filters
(gray bars) to separate emission for different detectors. This octagonal photomultiplier
tube detection system is configured to detect eight quantum dot fluorescences (b).
Dichroic long-pass filters transmit light at a certain wavelength to bandpass filters.
Light below a particular wavelength is reflected to the next dichroic filter in
the sequence. Reprinted from Nature Medicine with permission of the researchers.
Limit is colors
Michael R. Betts of the University of Pennsylvania
said that the practical limit today is 12 colors, a capability not often used. “The
vast majority, 95 percent, of researchers typically use eight colors or less,”
he said.
Part of the problem lies in traditional
labeling reagents. They have broad emission outputs and require different excitation
wavelengths. To compensate, some systems have as many as four lasers and multiple
detectors. The setup has to be extensively optimized, making it expensive to buy
and to operate.
Quantum dots, on the other hand, can
be excited by any wavelength below their emission. They also have narrow emission
peaks, making detection simpler because there is less overlap.
The researchers used quantum dots with
a cadmium-selenide semiconductor core. For biological applications, the quantum
dot cores are encased in a zinc-sulfide shell coated with organic polymers. In building
their 17-color cytometry system, the researchers used quantum dots with emission
peaks of 525, 545, 565, 585, 605, 655, 705 and 800 nm. They combined these with
nine standard fluorochromes, using diode lasers at 408, 488 and 532 nm, along with
a helium-neon laser at 635 nm for excitation.
As described in the August issue of
Nature Medicine, they steered the lasers individually into the cytometry
chamber with a series of mirrors. The lasers emitted in a timed sequence of 488,
408 or 635 nm and then 532 nm. For detection, they used a series of photomultiplier
tubes and optical filters. The light entered an octagonal assembly containing the
photomultiplier tubes. They directed the light inside using dichroic mirrors to
the correct photomultiplier tube/filter pair and detected the emission.
Betts noted that the quantum dots provided
additional colors to those of the other fluorophores without complicating things.
“The equipment to view these reagents is expensive but relatively straightforward
— a violet laser and an octagon detector setup,” he said.
Using this equipment, the researchers
analyzed populations of T cells, which play a central role in the immune system.
They characterized the cells from a single HIV-positive individual in terms of response
to HIV, to cytomegalovirus and to Epstein-Barr virus.
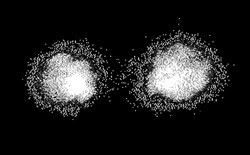
This in vivo image shows a single T cell in a mouse blood vessel (flowing from right to left),
labeled with the fluorescent probe DiD and imaged with two consecutive pulses separated
by 5 ms. The cell velocity is ~1.6 mm/s.
In the T-cell population, they found
almost every possible combination of negative, dim and bright expression for the
various fluorescent markers, validating the need for multiparametric analysis. For
example, they found Epstein-Barr-virus-specific T cells to express a particular
sequence of dim and bright fluorescent marker emission, with cytomegalovirus-specific
cells expressing a similar sequence for many of the markers. The difference came
largely in two specific labels, which were mostly negative and bright for Epstein-Barr
but often dim for cytomegalovirus. Even within HIV-specific T cells, the variation
was great.
Applications for the quantum dot cytometry
include human cancers, stem cell research, vaccine studies, mouse and primate models,
and the study of antigen-specific T cells and their differentiation. The latter,
the researchers reported, might benefit the most from the technique.
Because quantum dots contain heavy
metals such as cadmium, their use in cytometers presents a potential environmental
risk. The fluorophore disposal problem may have a simple solution, and it may not
be an issue at all.
Research team member Marcel P. Bruchez
is an associate research professor and program manager for the technology center
for networks and pathways at Carnegie Mellon. Previously, he was a founder of a
company commercializing quantum dots. He noted that more research must be done.
“We have not got a complete picture of what the safety of these quantum dots
materials is,” he said.
Going live
The third cytometry innovation comes from researchers
at the Wellman Center for Photomedicine, part of Boston-based Harvard Medical School.
The group added fluorescence imaging to a cell-counting flow cytometer to create
an in vivo imaging flow cytometer. The instrument can detect and capture information
on fluorescently labeled cells circulating in a live animal, noted team leader Charles
P. Lin. “Immediate applications are in the studies of circulating tumor cells
and immune cells in mouse models of disease,” he said.
Human applications are more long-term.
Methods to identify particular cell populations in the bloodstream will have to
be developed. One approach might be to use intrinsic optical cell signatures for
identification, while another might be to use fluorescent probes approved for humans.
In building the instrument, the researchers
started with an in vivo flow cytometer that used a Melles Griot helium-neon laser
operating at 632 nm for a counting beam and a Hamamatsu photomultiplier tube for
cell detection. They focused the beam onto a selected blood vessel, exciting fluorescence
in labeled cells. Optics captured that emission, which traveled through a confocal
slit before reaching the photomultiplier tube.
To this setup the researchers added
a second HeNe laser, and an electron-multiplying CCD from Andor Technology. They
offset the second beam from the first by about 25 μm at the target surface.
Via a beamsplitter and other optics, they directed the image onto the CCD.
They used the counting signal from
the photomultiplier tube as a trigger for the second, imaging beam. When a cell
passed the counting window, the imaging laser flashed, producing a fluorescent image
captured by the CCD. To control the delay between trigger and strobe, they used
an Andersen Laboratory acousto-optic modulator to gate the imaging beam. Lin noted
that the technical requirements weren’t that challenging. “The temporal
resolution, 10 to 100 μs, was not all that demanding — much faster imaging
systems have been used by many groups, including our own,” he said.
The modulator was versatile enough
that the delay could be adjusted, allowing capture of multiple images of a cell.
That ability meant that such information as cell velocity and even direction could
potentially be extracted.
The researchers demonstrated the instrument
using a mouse model. To locate the blood vessel of interest, they placed a green
LED behind an anesthetized animal’s ear and imaged that onto a CCD camera
with a large field of view. They labeled isolated T cells with a Molecular Probes
dye that binds to the cell membrane, with an excitation peak at 647 nm and an emission
peak at 669 nm. After injecting the cells into test animals, they observed the arteries
of five mice, with an average diameter of 20 μm.
An analysis of 119 images showed that
98 percent of signal peaks from the counting photomultiplier tube were due to single
cells, with the rest doublets where two cells were imaged together. The actual fluorescence
intensity varied some thirtyfold between cells, a difference that led to variability
in peak photomultiplier tube intensity. Another contributing factor to intensity
variation, the researchers found, was the axial position of the cell when it passed
the counting window. The work is described in the Aug. 21 issue of Optics Express.
As for uses of the instrument, Lin
noted that his group is doing studies on the kinetics of T cells and cancer cells
in circulation. It also is working to enhance the in vivo imaging flow cytometer.
“We are improving multichannel detection capabilities and detection sensitivity,
or cell-counting efficiency,” he said.
The goal, he added, is to detect a
single circulating cell, which may not be possible with the current technique. However,
it may detect as few as 100 cells, an important threshold for research.