Barbara Foster, The Microscopy & Imaging Place
An exponential rise in quantitative fluorescence and live-cell work is driving a need for microscopists to understand, control and calibrate their instrumentation.
For decades, there has been talk about a mechanism for measuring and calibrating true illumination intensity, not at the source or somewhere in the optical path, but specifically at the sample plane, taking into account all the interactions between the light source, optics and filters.
The experimental questions are fundamental and critical. “Is my light source stable from day to day?” “Is the change I see in fluorescence intensity the result of some change in my sample, or is it a fluctuation in illumination?” “How can I quantify fluorescence if the incoming illumination is an unknown?”
In the early days, as is often the case, the gurus built their own. As lasers entered the illumination market, laser companies began supplying light path power meters with their more sophisticated systems. Crafty microscopists began using these power meters to quantify the incoming light but found that the paddlelike configuration didn’t do well on the light microscope, especially in an inverted configuration. It was too bulky, did not sit squarely on the stage and could not be placed consistently in a defined plane and at a reproducible angle in the light path.
A stage-based focal plane power meter solves these problems. Built to mimic the configuration of a traditional 25 x 75-mm microscope slide, it fits neatly onto a conventional microscope stage, either upright or inverted, finally providing a straight-forward method for calibrating intensity expressly in the sample plane.
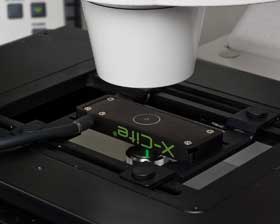
The X-Cite XP750 focal plane microscope power meter in use on an inverted microscope. Courtesy of XCite.
Microscope or slide?
Princess Margaret Hospital’s Advanced Optical Microscopy Facility in Toronto was having problems using its new confocal microscope to image DAPI (4´,6-diamidino-2-phenylindole) fluorescence.1 Although the signal looked fine when viewed through the eyepieces, the sample seemed to require dramatically increased laser power to acquire an acceptable image of the DAPI-stained nuclei. Historically, the prime suspect for the higher laser power demand would have been poor sample preparation. However, this particular microscope had been monitored intermittently with the focal plane power meter over approximately six months (see Table 1).
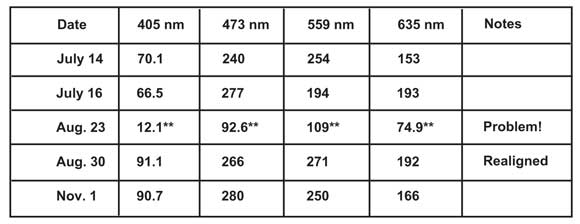
Table 1. Periodic monitoring of illumination intensity quickly differentiates between sample preparation and alignment problems.
A review of the data uncovered unusual and abrupt losses in intensity across all the channels during the Aug. 23, 2010, tests (marked with ** in Table 1), suggesting that, rather than the sample preparation, there was a serious problem in the laser alignment. Tracing the alignment along the laser pathway revealed that the lasers themselves were in place but the incoming fiber had been knocked off-axis. Once realigned, the system was quickly up and running at peak performance.
Heading off problems in core labs
Multiuser core facilities face these issues multiplied tenfold or a hundredfold, according to Dr. Jennifer Waters, director of the Nikon Imaging Center (NIC) at Harvard Medical School.2 “The driving force for monitoring illumination intensity comes from recent trends toward quantitative microscopy and live-cell imaging.”
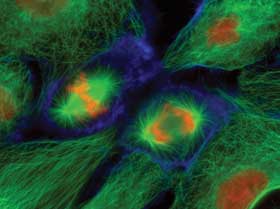
PtK1 epithelial cells labeled for microtubules (green), actin (blue) and DNA (red/orange). Collected with a wide-field fluorescence microscope at 400x. Courtesy of Dr. Jennifer Waters, Nikon Imaging Center at Harvard Medical School.
In live-cell work, researchers, worried about damaging their cells by longer exposure to light, must collect images quickly. As a result, they are becoming increasingly aware of questions such as, “Why is the intensity of my image dropping?” “Why aren’t my cells as bright as they were last time?” “What’s going on with my illumination?” “Why are my exposure times getting so long?”
NIC researchers and students tried to answer these questions using the standard handheld laser power meters described above, but they were met with the same frustrations. Manually holding the power meters over the objective, they could never be sure exactly where and what they were measuring.
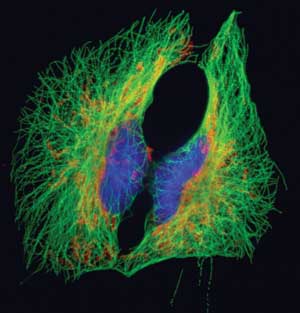
BSC1 epithelial cells labeled for microtubules (green), mitochondria (red/orange) and DNA (blue). Collected with a wide-field fluorescence microscope at 600x. Courtesy of Dr. Jennifer Waters, Nikon Imaging Center at Harvard Medical School.
Today, NIC has two solutions to this problem. The first is provided in its course, “Care and Teaching of the Microscope.” Using carefully controlled experiments, students learn how to check fluorescence intensity as well as how to use the focal plane power meter to calibrate the intensity from the illumination. The goal is to help them clearly differentiate between changes in fluorescence intensity resulting from the sample preparation versus problems with the microscope.
The second solution is the lab’s standard maintenance protocol. “I learned pretty quickly that we couldn’t rely on users to check microscopes,” said Waters, who has been in this lab for 10 years. “The assumption is that when you turn the microscope on and see light, it is working. In reality, illumination intensity can drop 25 percent and still look the same to your eye, but the difference experimentally (especially on quantification) can be huge.”
To answer this challenge, Laura Petrak, NIC’s equipment manager, developed a microscope performance checklist and now conducts weekly scope checks on its 15 research-level microscopes. Rather than waiting for someone to tell her that a microscope is having a problem, she ferrets out the problems – often finding and resolving issues that the users can’t see – before they affect the students and researchers. The focal plane power meter is a critical tool in her arsenal.
Hidden problems, quick fixes
As fluorescence illumination has evolved from tungsten filament to arc sources to metal halide systems, a potential new source of inconsistency has crept into the optical train: failure in the liquid lightguide (LLG) that connects the lamp to the stand. This problem adds a new dimension to more traditional culprits such as delamination or burned areas in filters or heat shields, foreign objects stuck where they shouldn’t be, aging in the lamp itself, or problems with the camera.
Most microscopists expect LLGs to last forever. Although they typically last significantly longer than the metal-halide source (rated ~2,000 h), their life is finite, and they occasionally need replacing. In multiuser/core labs, waiting for the local microscope representative to visit the lab and fix the problem can cause shutdowns and delays. As Waters sees it, “It’s helpful if you can do it yourself.”
Her first step is to confirm that the setup is correct. Her second is to reach for the power meter to measure the intensity of the incoming illumination. If the intensity is the same as the previous reading, the problem is more likely to be somewhere after the sample plane, in the sample preparation, the emission filter or the camera. If the intensity differs, she recommends checking everything in the incoming light path. If each component is working properly, the only remaining possibilities are the lamp or the LLG.
Testing the health of the liquid lightguide is simple: Turn off the bulb and remove both ends of the liquid lightguide. Hold one end up to room light and observe the light coming through the other end. The view should be clean and free of artifacts. If there is no light or if there are dark spots, change the LLG. If the LLG is fine, change the bulb.
New baselines for DIYers
The Yip Lab members at the University of Toronto are laser-focused in their research in single-molecule biophysics but “trans-, cross-, and multidisciplinary” when it comes to their approach. According to principal researcher Dr. Christopher Yip,3 many of the researchers in this lab build their own equipment, and, for more than a decade, they have struggled with laser-measuring wands and paddles, always frustrated with the inability to ensure that the intensity was being measured at the same location and angle in the optical path each time.
The XP 750 sits flat on the microscope stage, always at a 90° angle to the incoming beam. “It has a shallow learning curve,” Yip said. “Undergraduates can just grab it and start using it. And even though it is portable, it always ends up measuring in exactly the same spot.” The result: In the Yip lab, calibration is now an integral part of the experimental routine, beginning with a student’s earliest experiments.
Yip said data logging is critical for people building their own microscopes: “It’s handy to have the microscope talk to a computer. The focal plane power meter provides that link, integrating directly into the microscope control system, then interfacing with the computer.”
He described one experiment involving the use of visible light for photoactivation conducted inside an IR spectrometer. Of major concern was the precise quantification of the power at the crystal face where the photoactivation occurs. By building a flow cell and placing the focal plane power meter at the bottom of the cell, the team could read the intensity consistently, logging the readings directly into the computer as part of the experiment.
Inter-lab collaboration
Work at The BioImaging Group in the Life Sciences Div. at Lawrence Berkeley National Laboratory (LBNL) also centers on correlative microscopies. LBNL’s Damir Sudar4 conducts research on the impact of low-dose radiation (a US Department of Energy [DoE]-funded project) and the basic molecular mechanism underlying breast cancer. Both projects involve observation of subtle changes over long periods, and Sudar has to be certain that his measurements are consistent day to day.
He noted that the BioImaging Group is different from many core labs in that researchers tend either to have their own microscopes or to tailor an existing microscope for their own work. Many of these projects involve collaboration with other labs or correlation of imaging modes.
Much of his work focuses on relating the intensity of the fluorescence signal to the number of fluorophore equivalent molecules. In the DoE project, a cell or mouse model is exposed to a low dose of radiation (just 100 µrad) over a prolonged period. Various types of radiation affect cells differently, but Sudar is most interested in double strand breaks in DNA. In response to the break, the cell recruits a repair molecule, Gamma H2AX. Fluorescently tagging the Gamma H2AX shows exactly where the repair is occurring. Counting the number of spots in the nuclei as well as the size and intensity provides insight into which irradiation causes more or less recruitment of the repair molecule.
A number of factors complicate the experiment. The main issue is dynamic range. Although individual spots may exhibit low intensity, stronger reactions produce bright areas. Stability throughout the entire optical system is critical, and, without calibration, delicate, subtle signals would be lost in the noise. One alternative to calibrating for such a broad dynamic range would be setting up huge calibration experiments, but these are time-consuming and difficult to repeat over time.
Instead, Sudar recommends a two-step approach. The first is to install a consistent, controllable light source. The second, conducted prior to beginning the experiment, is to use the focal plane power meter to calibrate the system response from lamp, filters and the optical pathway for the excitation wavelength. “The expectation is that setting up in the beginning, the system is sufficiently stable throughout the experiment,” Sudar said. “Using the power meter, the system response can be measured and remeasured as needed, to ensure consistency from experiments run months ago, days ago, today and into the future.”
Meet the author
Barbara Foster is president of and chief strategic consultant at The Microscopy & Imaging Place Inc. and Microscopy/Microscopy Education in McKinney, Texas; e-mail: [email protected]. The author wishes to thank the core labs, facility managers and principal investigators who so freely shared their insights.
References
1. J. Jonkman and K.K. Aswani (February 2011). “The X-Cite® Power Meter: an important addition to any quantitative fluorescence microscopy tool kit.” Case Study: X-Cite®.
2. Dr. Jennifer Waters, director, Nikon Imaging Center at Harvard Medical School. Private communication. Feb. 8, 2011.
3. Dr. Christopher Yip, the YIP laboratory, the Donnelly Center at the University of Toronto. Private communication, Feb. 8, 2011.
4. Dr. Damir Sudar, The BioImaging Group, Lawrence Berkeley National Laboratory. Private communication, Feb. 11, 2011.