The intensity of the fluorescence emissions from cancer cells relative to excitation light provides a possible gateway for the rapid and accurate optical imaging of tumors.
PETER JERMAIN AND ANNA YAROSLAVSKY, UNIVERSITY OF MASSACHUSETTS LOWELL
Fluorescence polarization (Fpol) is an optical phenomenon that characterizes the polarization of fluorescence emissions relative to the polarization state of the excitation light. It is sensitive to factors that influence the rotational motion of the fluorophores during the lifetime of the excited state, for example, binding and viscosity. The binding of fluorophores to larger macromolecules reduces rotational mobility and preserves high Fpol. Similarly, high Fpol values will be exhibited by fluorophores in a viscous environment that restricts rotational movement.
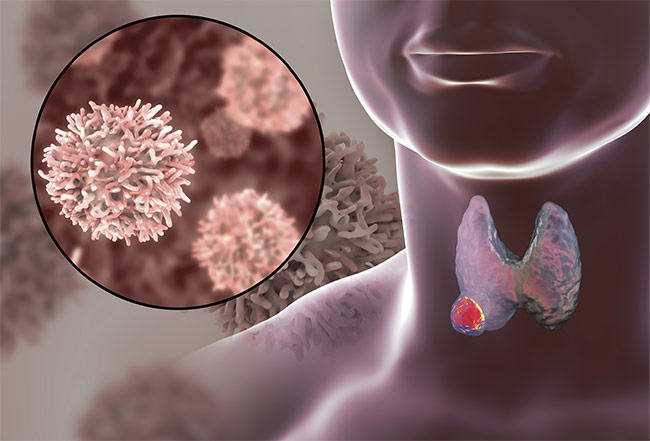
A 3D image of a thyroid gland with a tumor inside the body. Courtesy of iStock.com/Dr-Microbe.
A common formula to describe this phenomenon is as follows:
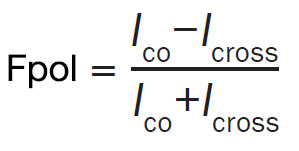
where Ico and Icross represent fluorescence intensities polarized in the planes that are parallel and perpendicular to that of the excitation light, respectively1.
Authors at the Advanced Biophotonics Laboratory of the University of Massachusetts Lowell are exploring the applicability of Fpol of exogenous fluorophores including methylene blue, toluidine blue, tetracycline, and demeclocycline in cancer diagnostics. Each of these dyes can be introduced to a sample or a patient via topical application, injection, or orally, allowing them to be useful in a wide variety of research or clinical settings.
Recently, the researchers have focused on the Fpol of methylene blue, a positively charged phenothiazine dye that absorbs light in the red spectral range and fluoresces in the red and near-infrared spectral range with an emission peak of ~695 nm (Figure 1). Conveniently, the methylene blue fluorescence emission does not spectrally overlap with major endogenous tissue fluorophores. Additional advantages of methylene blue include its wide availability and acceptance as a cytological stain in pathology, and it is well established in clinical use in vivo for tracking lymphatic metastases of breast and thyroid cancers during sentinel node biopsy procedures.
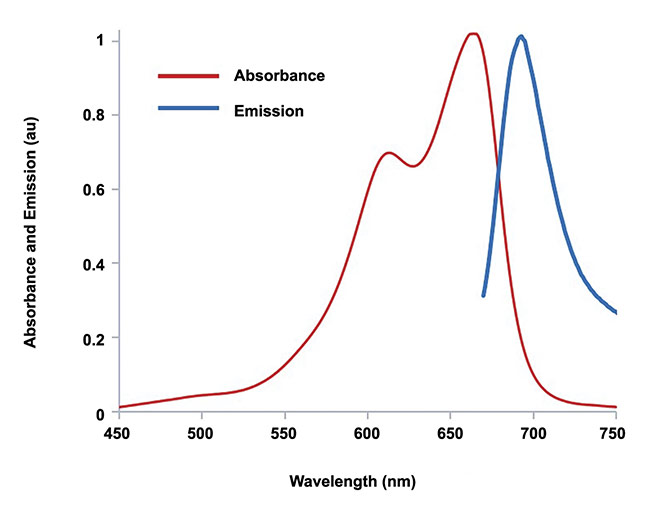
Figure 1. Absorbance and emission spectra of a 0.05 mg/mL aqueous solution of methylene blue.
Courtesy of Advanced Biophotonics Lab/University of Massachusetts Lowell.
Several studies have demonstrated that exogenous Fpol of methylene blue is greater in malignant tumors than in normal tissues and cells, so it can be used for cancer diagnosis2. The authors have employed this technique at the macroscopic level to delineate skin, breast, and brain tumor margins, and at the microscopic level to detect malignant breast, brain, and renal cells.
To explain the increased Fpol of methylene blue in cancerous tissues, several studies were conducted with cultured human breast and brain cells. They confirmed that Fpol values are significantly elevated in cancerous cells in comparison to noncancerous cells. In addition, the experiments revealed that higher Fpol occurs due to a shorter fluorescence lifetime of methylene blue in cancer and greater accumulation of the fluorophore in the mitochondria of malignant cells3. Positively charged molecules such as methylene blue are preferentially attracted by elevated negative mitochondrial membrane potentials in cancer cells.
As the mitochondrial matrix is more viscous than the surrounding cytosol, increased accumulation and/or binding of methylene blue in mitochondria may result in high Fpol, because it restricts rotational motion of the dye molecules during the fluorescence lifetime.
Thyroid cancer diagnostics
Thyroid cancer presents a significant challenge for both patients and the health care system due to its prevalence and difficulty of diagnosis. Epidemiological studies indicate that most adults will develop one or more thyroid nodules during their lifetime. Elevated mitochondrial membrane potentials are a common characteristic of thyroid cancer; therefore, the authors hypothesized that Fpol technology could be used to detect the disease.
The current clinical approach for thyroid cancer diagnosis involves fine needle aspiration cytology, in which cells are obtained from the nodule and examined under a microscope. This method requires subjective visual assessments of single-cell morphology to identify the presence or absence of cancer. As a result, diagnostic accuracy is reliant on the skill and experience of the pathologists. According to the Bethesda system for reporting thyroid cytopathology, indeterminate thyroid nodules are thyroid nodules that cannot be definitively diagnosed as benign or malignant based on fine needle aspiration assessment alone4. About 30% to 40% of thyroid fine needle aspiration cases result in inconclusive findings, requiring additional evaluations that are invasive, expensive, and/or time consuming.
Quantitative detection potential
To evaluate the potential of methylene blue Fpol to detect thyroid cancer in single cells, the authors conducted a double-blind clinical study5. In total, 32 cytology specimens were collected, including 19 from UMass Memorial Medical Center in Worcester, Massachusetts and 13 from Lowell General Hospital in Lowell, Massachusetts. Clinical specimens included different types of cancerous tissue, including medullary thyroid carcinoma, papillary thyroid carcinoma, follicular thyroid carcinoma, benign tissues including follicular thyroid adenoma and multinodular goiter, and normal thyroid tissue. All samples were obtained immediately following surgery from excess, deidentified thyroid tissues under a protocol approved by the institutional review boards of the University of Massachusetts and Lowell General Hospital.
A custom-built, multimodal confocal microscope equipped with a 63×/NA 1.4 oil immersion objective lens was used to image the thyroid cells (Figure 2). The methylene blue was excited at 642 nm. Copolarized and cross-polarized methylene fluorescence emission images of the cells were registered between 670 and 710 nm and used to generate quantitative Fpol images. The microscope provided a field of view of 205 µm2, axial resolution of 3 µm, and lateral resolution better than 0.9 µm.
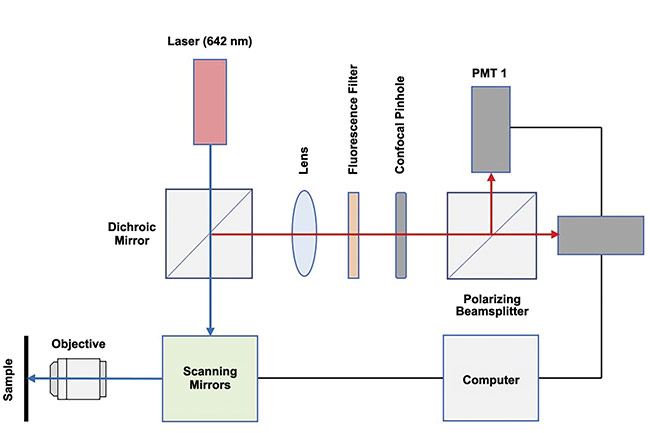
Figure 2. A diagram of a confocal fluorescence emission and polarization imaging system. Courtesy of Advanced Biophotonics Lab/University of
Massachusetts Lowell.
Following imaging, the Fpol values of the cells were determined. The results from optical imaging were statistically analyzed and compared to the images obtained via clinical histopathology. Cell viability tests established that more than 91% of cells remained alive after the experiments, meaning the technology can be implemented in vivo and the same samples can be tested multiple times.
Figure 3 presents examples of multimodal optical images of cancerous and benign thyroid cells. The fluorescence emission images in panels a and b of Figure 3 display cell features, including nuclear size and shape. To aid morphological evaluations, the fluorescence emission images were digitally stained based on pixel intensity to mimic Papanicolaou stain. The cell nuclei are purple, whereas cytoplasm is light blue. Corresponding pseudo-colored Fpol images in Figure 3 panels c and d provide a quantitative measurement for each cell. The colors represent the magnitude of the Fpol signal at each pixel, as indicated by the color bar range between 0.0 and 0.40.
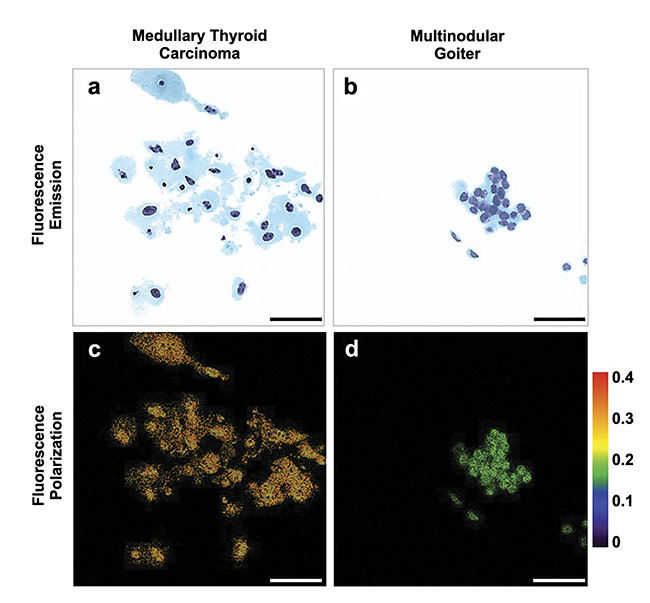
Figure 3. Multimodal optical images of cancerous and noncancerous thyroid cells. Scale bar: 50 µm. Adapted with permission from Reference 5/CC BY 4.0.
Figure 4 presents multimodal optical images of cells that were obtained from indeterminate thyroid nodules, meaning the pathologists could not reliably classify the cells as cancerous or benign. Panels a, b, and c of Figure 4 display methylene blue fluorescence emission images of papillary thyroid carcinoma, follicular thyroid carcinoma, and follicular thyroid adenoma cells, respectively. Corresponding Fpol images are presented in Figure 4 panels d, e, and f. The fluorescence emission images show subtle differences in cellular morphology that are hard to distinguish even for the experienced and well-trained pathologists. In contrast, Fpol images provide distinct quantitative discrimination between malignant and benign cells. Specifically, in polarization images, cancerous cells (Figure 4d,e) are yellow/red, whereas noncancerous cells (Figure 4f) are blue/green, corresponding to average Fpol values of 0.25 and 0.20, respectively. These examples indicate that optical Fpol imaging is capable of quick identification of malignant cells.
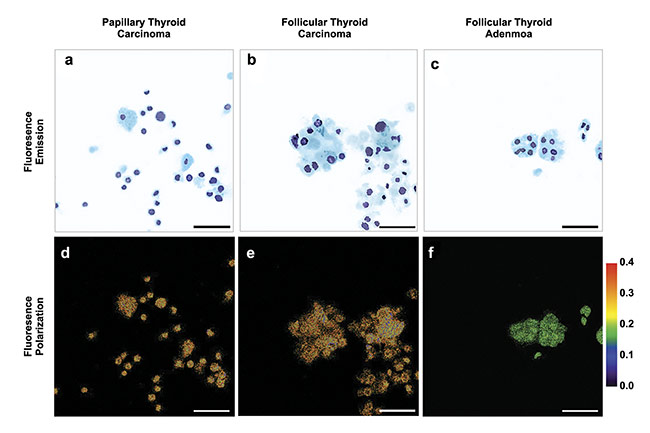
Figure 4. Multimodal optical images of cells with indeterminate cytology. Scale bar: 50 µm. Adapted with permission from Reference 5/CC BY 4.0.
Under well-controlled conditions, a threshold value of fluorescence polarization could be used to sort cells into the correct malignant, benign, or normal category.
Statistical analysis was performed using a linear mixed-effects model to evaluate the significance of the differences between cancerous and noncancerous thyroid cells6. In Figure 5a, samples were organized into three diagnostic groups: malignant, benign, and normal. Fpol was significantly higher in the malignant group versus the benign or normal groups. In Figure 5b, the grouping by histological classification demonstrated that Fpol was significantly higher in malignant specimens for all the cancerous versus noncancerous sample comparisons. Most important, the analysis of 12 specimens obtained from cytologically indeterminate thyroid nodules revealed that methylene blue Fpol values in the malignant nodules were significantly higher than those in the benign nodules (Figure 5c).
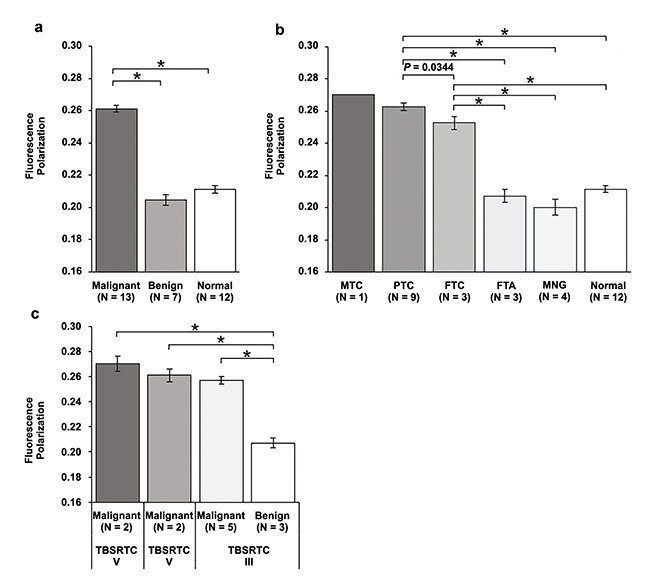
Figure 5. Methylene blue fluorescence polarization of thyroid samples. Error bars represent standard errors, N is the number of samples, *P < 0.0001. Adapted with permission from Reference 5/CC BY 4.0.
The scatter plot in Figure 6 shows Fpol values versus cell size for all 3521 cells analyzed. The plot demonstrates that Fpol values reliably identify specimens with cancerous cells, irrespective of patient or cancer type. Furthermore, none of the cells in a benign or normal sample exhibited Fpol >0.245. This finding suggests that, under well-controlled conditions, a threshold value of Fpol could be used to sort cells into the correct malignant, benign, or normal category.
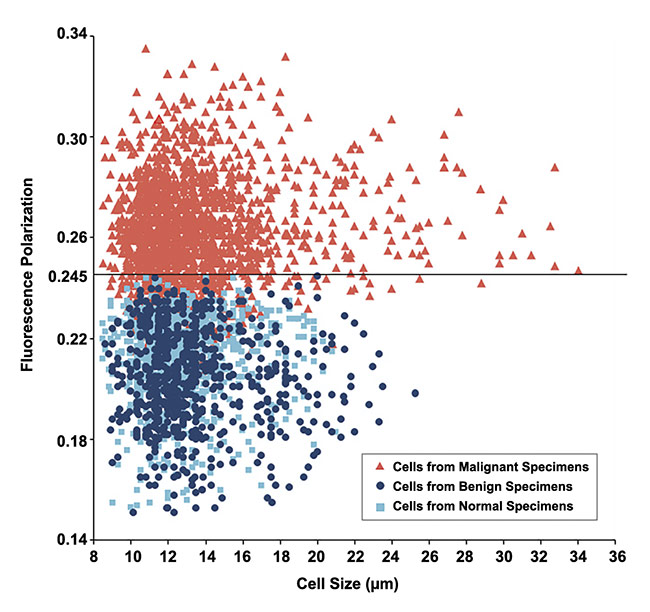
Figure 6. Methylene blue fluorescence polarization value versus cell size for all cells from 32 clinical thyroid specimens. Adapted with permission from Reference 5/CC BY 4.0.
A new tool for cytopathology
Accurate diagnosis of thyroid cancer using thyroid fine needle aspiration cytology is challenging to consistently achieve in a clinical setting. Therefore, a reliable method to detect thyroid cancer at the cellular level would be invaluable to reduce diagnostic uncertainty and improve clinical decision-making. By imaging the Fpol of methylene blue, the authors were able to accurately discriminate between cancerous and noncancerous thyroid cells in an assortment of clinical specimens. Their results indicate that Fpol could augment current cytopathological evaluations and reduce the need for expensive molecular genetic testing or diagnostic surgeries. Fpol can also be used as a standalone technique.
Fpol imaging is rapid and robust, and it does not require expensive equipment or sophisticated data-processing algorithms. Moreover, the acquisition of a dedicated cytological sample is not necessary, and it does not cause significant disruption to current clinical workflows. To improve the translational potential of Fpol imaging even further, the authors are developing rapid sample staining/preparation protocols and cell auto-segmentation techniques to decrease the time that is required for the imaging and analysis of the cytology specimens, respectively. Furthermore, a miniaturized imager is undergoing development, using direct feedback from pathologists and surgeons.
A significant advantage of this method is that cell viability is not adversely affected during or after imaging. Methylene blue is approved for human use; therefore, the technology could be used in vivo to deliver a diagnosis without the need for tissue acquisition or processing, or to guide the fine needle aspiration specimen collection and reduce incidence of nondiagnostic cytology samples.
Importantly, the described optical approach may be capable of detecting multiple types of cancer cells characterized by increased mitochondrial membrane potentials. This includes lung, kidney, pancreas, and colon cancers in addition to other malignancies previously investigated by the authors (e.g., breast, brain, skin, and renal cancers).
Fpol of methylene blue has proved to be a reliable, quantitative biomarker for thyroid malignancies. Further development of this optical technique could enable transformative changes to the standard of care for cancer diagnosis as it continues its initial success in clinical settings.
Meet the authors
Peter Jermain is a visiting scientist at the Advanced Biophotonics Laboratory of the University of Massachusetts Lowell. He recently earned his Ph.D. in medical physics from the University of Massachusetts Lowell. In July 2023, he will start the Radiation Physics Residency Program at MedStar Georgetown University Hospital in Washington, D.C.; email: [email protected].
Anna Yaroslavsky is professor of physics and director of the Advanced Biophotonics Laboratory at the University of Massachusetts Lowell. She is a visiting scientist at the department of dermatology at Massachusetts General Hospital. Her research focuses on the development of methods for light dosimetry and on multimodal approaches for functional and structural characterization of biological tissues, as well as pathology detection and treatment. She has been elected fellow member of SPIE and Optica; email: [email protected].
References
1. J.R. Lakowicz. (2006). Principles of Fluorescence Spectroscopy, 3rd ed. Springer, pp. 353-382.
2. A. Mitrou and A.N. Yaroslavsky. (2023). Exogenous fluorescence polarization imaging for cancer detection. In Optical Spectroscopy and Imaging for Cancer Diagnostics. N. Melikechi, ed. World Scientific, 139-180.
3. A.N. Yaroslavsky et al. (2019). Fluorescence polarization of methylene blue as a quantitative marker of breast cancer at the cellular level. Sci Rep, Vol. 9, No. 1, p. 940.
4. E.S. Cibas and S.Z. Ali. (2017). The 2017 Bethesda system for reporting thyroid cytopathology. Thyroid, Vol. 27, No. 11, pp. 1341-1346.
5. P.R. Jermain et al. (2022). Fluorescence polarization imaging of methylene blue facilitates quantitative detection of thyroid cancer in single cells. Cancers (Basel), Vol. 14, No. 5, p. 1339.
6. E. Demidenko. (2013). Mixed Models: Theory and Applications with R, 2nd ed. Wiley, pp. 1-713.