RONALD MUELLER, VISION MARKETS

Meet the author
Ronald Mueller is an expert in the global machine vision industry, with a Ph.D. in computer vision and machine learning. Based on his technical know-how, his experience as a corporate executive, and his first-hand experience in machine vision sales in Europe, North America, and China, he founded the consulting firm Vision
Markets in 2014. He, his team, and the
Vision Markets Network of experts are
dedicated to making businesses thrive in this globalized growth market of machine vision; email: [email protected].
The end of the calendar year is here; it’s that time when
corporate leaders take stock of the overall market and
how their results fared against the competition’s. And
one thing we’ve learned from 2019 is clear: The days of double-digit, or even high single-digit, growth rates are over for the
immediate future, despite the positive performance over the
last decade.
Looking ahead, this is also the time of the year when sales leaders must present and justify their revenue targets, while corporate managers must decide where to focus their marketing and sales initiatives to reflect the most promising regions and verticals for the coming year.
Reviewing performance, defining targets, and setting the focus of one’s business is complicated by the variety of target markets, the differences in economic regions, and the complexities of political trade disputes. There’s a strong temptation to simply stay the course and trust historical norms. With extra effort, however, an increased level of confidence in predictions can be gained. Here’s our assessment of the most important external factors shaping the vision market.
GDPs and exchange rates
The U.S., China, and Europe are the most relevant geographic regions for tracking machine vision technology. Their gross domes-
tic product (GDP) is the primary indicator of the general development of these economies. China has seen its growth decline by 0.2% year over year since 2017, and the first quarters of 2019 showed an acceleration in this trajectory. However, as China’s absolute GDP is about $13 trillion, the growth rates cannot be expected to sustain at even this rate, with some analysts speculating that the numbers from Chinese official reports have been inflated by 50%. Assuming that’s the case, the actual growth rate is likely far closer to the U.S.’s 2.3% year over year for second quarter 2019.

Today, factory automation is the primary trend shaping the machine vision market. The need for more production output and higher efficiency triggers the demand for new factories, manufacturing lines, machines, and, eventually, machine
vision equipment.
U.S. manufacturing GDP was approximately $2.3 trillion in 20181. This rate is based on the value in U.S. dollars at a given year, since many machine vision exporters from the U.S. sell their goods in their home currency to Europe and China.
Therefore, the high growth rates of manufacturing GDP need to be evaluated along with the changes in currency exchange rates. In 2018, the U.S. dollar fell against the euro by 4% and against the Chinese yuan by 2% when averaged and calculated year over year (graph on next page). Considering this decrease, the 2018 growth rates in manufacturing appear to be even higher.
Publicly listed machine vision companies
Evaluating firms that operate exclusively in the machine
vision space provides another critical performance reference.
U.S.-based smart camera and barcode scanner OEM
Cognex Corp. showed a 5% growth in revenue from 2017
to 2018, while the German machine vision camera OEM Basler AG ended up flat. The revenue of the German-based system module specialist ISRA VISION AG grew by 6%
and Pan-European distributor STEMMER IMAGING AG increased its business by well above 10%, partly fueled by acquisitions.
For 2019, an overall decline is expected for components and likely also for system modules. The increase in the
German players mainly derives from the valuation of the
U.S. dollar against the euro amid first quarter 2019 reports
of the OEMs showing contractions in their business.
Market analyses
Machine vision associations such as the AIA (North America), EMVA (Europe), VDMA (Germany), and CMVU (China) perform regular surveys about revenues and trends among their members. This data, enriched with dedicated research by market experts, can provide an estimate of the market size per region.

Change in the average U.S. dollar value against the euro, the yuan, and the
Canadian dollar.
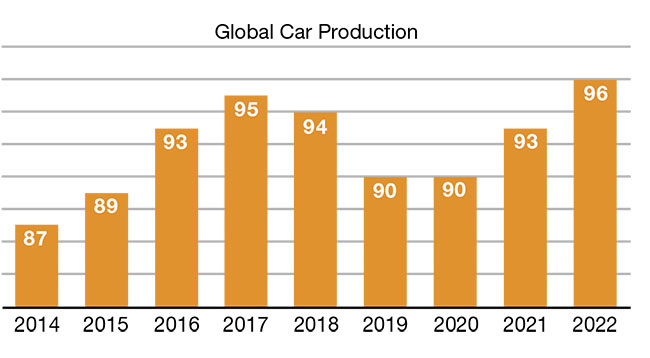
Global car production from 2014 to 2018 and the forecast from 2019 to 2022.
For 2018, the market for machine vision components, including smart cameras, was the same size in China and North America. Also, the DACH region (Germany, Austria, and Switzerland) accounted for half of the revenue of the entire EMEA region (Europe, the Middle East, and Africa).
Obstacles to growth
Several factors that were responsible for impeding market developments in 2019 will affect trends in 2020.
• Automotive production
One impediment is automotive production. For the first time in many years, global car production contracted from 2017 to 2018 and is forecasted to decrease from 95 to 90 million cars for 2019 and 2020. The reasons for customers buying fewer new cars — and thus, for the lower production numbers — are many. They range from the global economic cooldown in emerging markets, to the Volkswagen emissions scandal known as “diesel-gate,” to uncertainty about developments in e-mobility. A widespread adoption of SAE Level 3 (semiautonomous driving capabilities) is also expected on many new vehicles, with the start of production scheduled for 2020 to 2022.
With decreasing sales numbers, the release of new models is postponed by OEMs and, therefore, investment in new factories slows. Instead of building new factories, the automotive OEMs are funding research in new electric and hybrid drive capabilities, along with driver assistance systems, which again reduce investments in factories, with some exceptions, such as Volkswagen’s recently opened plants for batteries and electric cars in Germany. Here at Vision Markets, we anticipate machine vision sales in the automotive production sector will recover significantly at OEMs and tier ones by quarter four 2020.
As soon as OEMs start building production lines for new models, machine vision sales will likely recover to previous levels. Providers that specialize in manufacturing automation and quality inspection for ultrahigh-precision parts for combustion engines, however, need to prepare for a sustainable decline in their target market. By and large, the components in electric vehicle engines do not require the same level of machining.
• Semiconductors
The global semiconductor market was another impediment. Overproduction in 2018 lead to the buildup of massive inventory throughout the supply chain. Demand from target industries couldn’t keep up.
Throughout 2019, prices have continued to fall and production has decreased, leading to a decline in the market by
10% compared to the year before. Because of the broad adoption of machine vision in semiconductor production,
revenue growth in machine vision components naturally
requires growth in semiconductors. A decline, however, lets the demand for vision components come to a halt, since only new manufacturing lines and machines are equipped.
ASM Pacific Technology Ltd., one of the leading equipment providers for chip manufacturing and surface mount technology, correspondingly showed revenue decreased by 24% year over year for the first half of 2019. However, the company’s revenue from its materials business, which is a leading trend indicator, rose 13% in quarter two versus quarter one 2019.
A 22% decline of the wafer fab equipment market is
expected for 2019, followed by a projected window of −
4% to 10% growth in 2020. The uptick will be fueled by a more balanced demand-and-supply ratio, coming mainly
from recoveries in smartphones and servers2. Looking at
the numbers of wafer fab equipment provider ASM International NV, there were obviously still ways to grow the year-over-year order income by 14% in quarter one and by 53%
in quarter two 2019, even in this difficult market environment.
• Trade disputes
President Donald Trump publicly pushed to reduce the
U.S. trade deficit, especially with China. This led to more
impediments. Scanning the results of the increase and counter-increase in tariffs, the trade deficit between the
U.S. and China contracted by $8 billion from quarter two 2018 to quarter two 2019. During this same period, U.S. exports to China shrunk by $6 billion, a decline of 19%.
Meanwhile, China’s exports to the U.S. decreased by
$14 billion, a decrease of 11%. From this short-term perspective, the trade war is harming both economies, as expected. By the relative numbers, however, the U.S. is suffering more than China.
U.S. machine vision companies are reporting not only a decline in revenue but especially in margin as they strive to keep the import prices stable for their Chinese distributors and customers, despite increased tariffs. This creates a
competitive advantage for OEMs from Europe. When companies such as Google move their production out of China to nearby shores such as Vietnam, building up the new factories increases the price pressure on the entire supply chain, irrespective of the countries of origin.
The Institute for Supply Management (ISM) Manufacturing Index came in at 47.8 in September 2019, which is the lowest number since June 2009. This marks the second consecutive month of contraction. The new export orders index is at 41%, the lowest level since March 2009. There are few indications as of this writing that the trade dispute between the U.S. and China is going to be settled any time soon. On the contrary, announcements from the White House incite fears that a tariff war with Europe is just around the corner, with tariffs imposed on European aircraft and other goods.
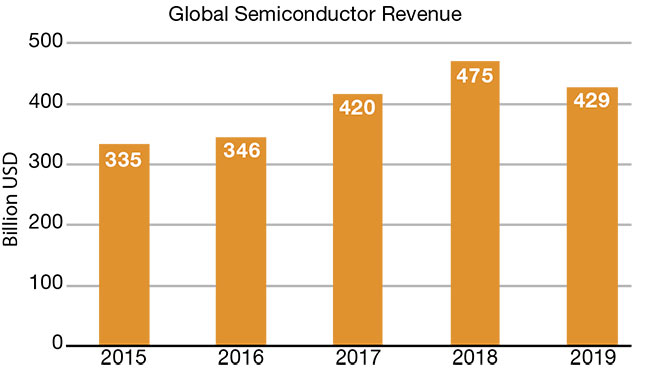
Estimated global semiconductor revenue in billions of dollars.
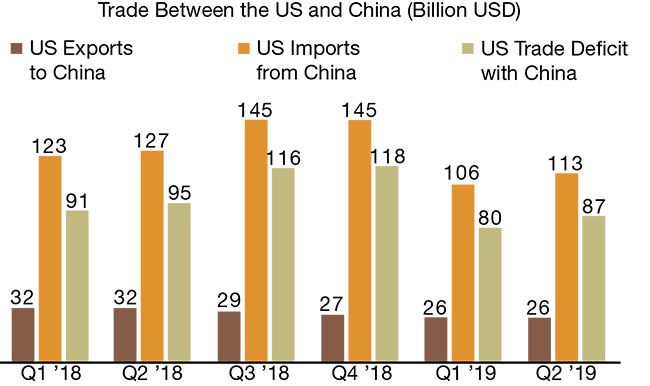
Quarter one 2018 to quarter two 2019 U.S. imports and exports to and from China.
2020 in focus
Machine vision component OEMs that make it through 2019 with a stable or a minor decline in
revenue of less than 3% will have performed better than the global market. In many companies, order books were still full from 2018 at the beginning of this year. Because this effect will likely not carry into 2020, and the economic outlook for the traditional machine vision target markets is not promising either, a further contraction is on the horizon. Factors include the slowing economy in China — one of the most important export markets for machine builders — and trade war issues in the U.S.
To properly plan for 2020, each company needs to consider its individual dependencies on vertical markets and regions. In tougher market conditions,
SMEs (small-to-medium enterprises) tend to let
their sales managers focus on selling and their product managers on making the existing portfolio successful. Effectivity in marketing communications, sales, and product management, however, requires substantiated data as the basis for decisions about the most promising verticals, regions, and target customer groups.
References
1. The U.S. Bureau of Economic Analysis.
2. VLSI Research (June 27, 2019). Wafer fab
equipment is expected to decline 22% in 2019 with potential recovery in 2H 2020, www.vlsiresearch.com/public/cms_pdf_upload/tci190627/Wafer-Fab-Equipment-is-expected-to-decline-22-percent-in-2019-with-potential-recovery-in-2H-2020.htm.