
Foveation and Spectral Imaging: Nature-Inspired Data Reduction for Efficient Devices
Spectral imaging in medical settings could become more practical if users actively select regions of interest in real time to inspect at high spectral resolution.
By Raja Srinivasan
Hyperspectral imaging (HSI) holds great promise for medicine as it matures into a practical technology. The fusion of imaging methods that spatially resolve light energy passing through an opening with methods that spectrally resolve the light can augment human perception — such as that of a doctor performing a diagnosis — by orders of magnitude. But HSI of sufficient resolution and bandwidth also increases data generation, transmission, processing, and storage requirements by orders of magnitude. Each bit operation consumes energy and generates heat, which directly affects the size, weight, and power (SWaP) requirements of devices based on HSI.
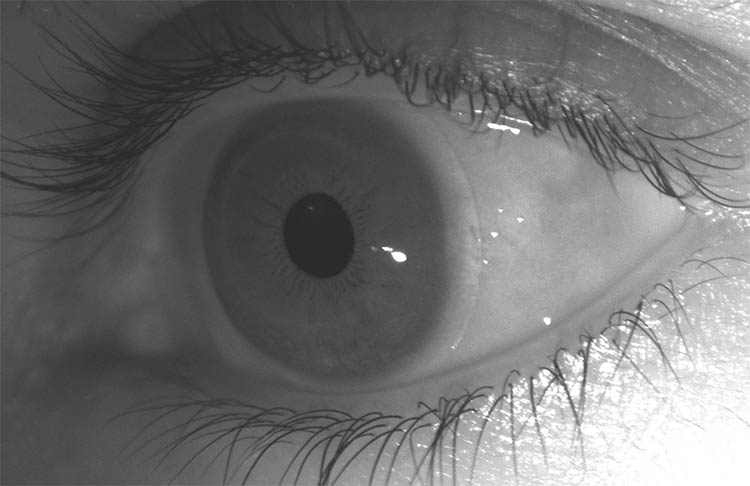
The human eye’s function could provide clues to make a hyperspectral imaging system more effective. Courtesy of ORCA Med.
Furthermore, HSI effectively reduces photonic throughput. Each axis of dispersion, whether horizontal, vertical, or spectral, results in dissipation of the photon flux over yet another dimension before reaching the photodetector. To compensate, one must increase exposure time and/or illumination power, or accept reduced signal-to-noise ratio.
These constraints and trade-offs affect the usability of photonic instruments in challenging use-case scenarios such as those in emergency medicine. The application of high-resolution spectral imaging to real-world medical problems, at least in the near future, may need to incorporate adaptations found in the visual systems of humans and other animals to optimally balance speed and latency, detail and resolution, and bandwidth and processing power.
The pit in the retina
Like many other simians, humans have a tiny “back-thinned” region of the retina called the fovea. The fovea maps to the center of the visual field where visual acuity is greatest (Figure 1). Correspondingly, the fovea is packed with the highest spatial density of cone-type photoreceptor cells, which underlie human color vision. Cones operate at light levels greater than twilight, as opposed to rod-type photoreceptors, which underlie human monochromatic vision in very dim light. Rods saturate at the light intensities needed to evoke detectable responses from cones. Cone density, spatial resolution, and visual acuity all decrease rapidly with increasing eccentricity (angular distance from the fovea).
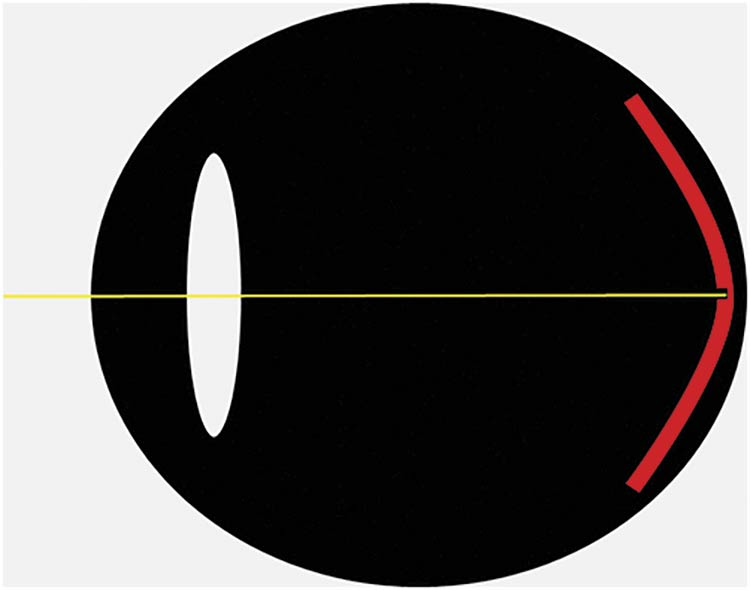
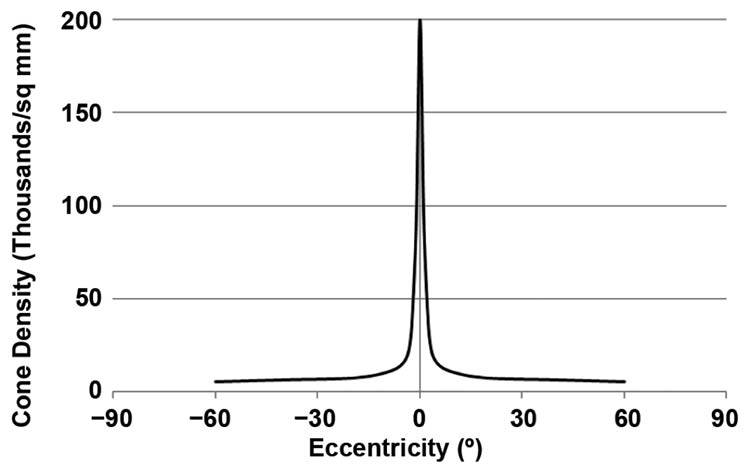
Figure 1. The fovea is a small ‘back-thinned’ region of the retina at the center of the eye’s optical axis (top). A replot of published human data showing the ~50× cone density difference between the fovea and most of the retina (bottom). Courtesy of ORCA Med.
Signals from the photoreceptors are processed by a multilayer neural network in the retina. The output layer of the network comprises retinal ganglion cells that transmit visual information centrally via the optic nerve. Each ganglion cell monitors a patch of visual space called its receptive field; the photoreceptors tiling the receptive field convey visual information to the ganglion cell via an interneuronal layer. Receptive field sizes increase with eccentricity, as does the spacing between ganglion cells. Thus, disproportionately more axons in the optic nerve carry information from the central retina than from the periphery (Figure 2).

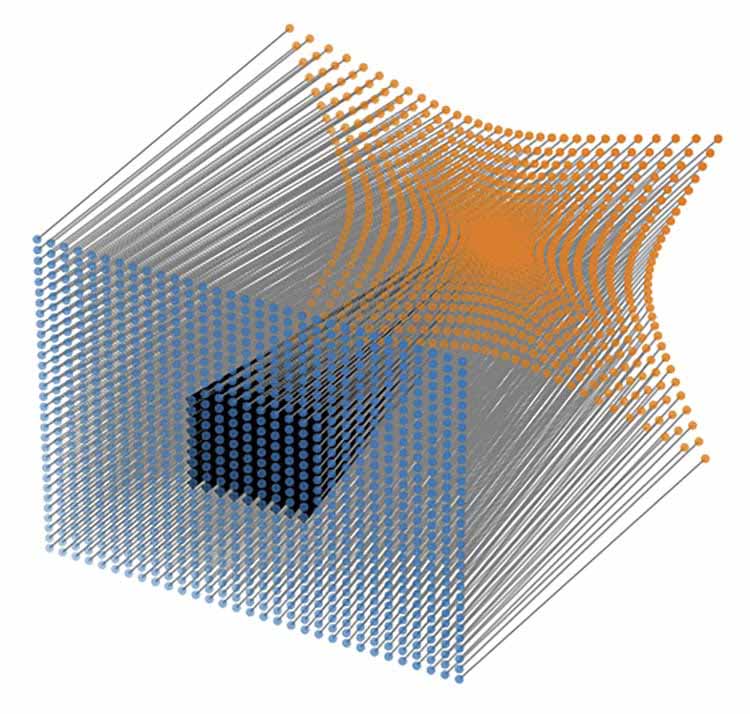
Figure 2. An inhomogeneous sampling lattice generated by deforming a square array (top). Inhomogeneous retinal sampling contributes to a disproportionately greater need for interconnect volume in the optic nerve, as well as increased surface area of the cerebral cortex to process foveal information compared to peripheral information (bottom). Courtesy of ORCA Med.
For the visual system to process information from the entire retina at the same resolution as the fovea would require orders of magnitude more resources than could fit into the densely packed primate cranial cavity: more axons in the optic nerve, more cortical surface area to process the additional information, and more metabolic infrastructure to supply energy to the cortical fabric. Beyond size and power considerations, latency and processing speed would also be adversely affected: Information from the fovea takes much longer to be processed than information from the peripheral retina.
Pathology slide to patient’s bedside
The trade-offs between resolution, latency, processing speed, interconnect volume, and energy requirements also affect the design of man-made instruments. Promising results were obtained using near-infrared (NIR) spectroscopy and linear discriminant analysis to classify skin lesions as benign or malignant. Those researchers enumerated some of the issues they encountered with the instrumentation and techniques of the day: speed of acquisition, photonic throughput, device bulk, and portability.
A pathology slide can be held still for the duration of a hyperspectral scan, and each pixel in the field of view may be important. Image quality with adequate spatial and spectral resolution is foremost; exposure time may limit job throughput but not usability, tolerability, or diagnostic accuracy. Slide scanning is thus fundamentally different from diagnostic examination of a patient: Illumination power, stray/ambient light, movement artifact, power supplies, and bulk are much less constraining for benchtop laboratory applications than for patient examination.
Usability is paramount
Even for research, clinicians do not embrace bulky, cumbersome spectral imaging instruments that are slow, prone to artifact, and difficult for patients to tolerate. Lack of instrumentation designed around clinical constraints has in turn led to a dearth of medical spectral databases of normal and abnormal variants. Such databases are useful not only for clinical purposes but also for advanced research, such as training AI/ML classifiers. In contrast, for decades, both humans and AI have been trained using curated, labeled sets of histologic and radiographic images.
In 2015, the author began working with colleagues at the National Institute of Standards and Technology (NIST) in Gaithersburg, Md., to develop the medical spectrometric equivalent of Ansel Adams’ beloved spot meter. The spot meter is a hand-held optoelectronic instrument that reproducibly measures light intensity within a calibrated region of interest (ROI) outlined in the viewfinder. Figure 3 shows the first foveated spectral imager prototype and a typical viewfinding image, as well as the first successful noncontact acquisition from afar of a high-resolution NIR spectral signature: the reproducible diffuse reflectance spectrum of the shamrock leaf seen in the ROI. Additionally, the importance of cross polarizers or other techniques to suppress specular reflection is highlighted in Figure 3. Human skin is shiny in NIR, mucosal membranes are shiny even in visible light, and specular reflections mask the spectral characteristics of the underlying material. Cross polarization results in the ghostly appearance of the author’s normally brown wrist; NIR light actually penetrates through the melanin-rich skin into the subcutaneous tissues, and the image of the veins under the author’s skin is formed by spatially resolving the backscattered NIR light.
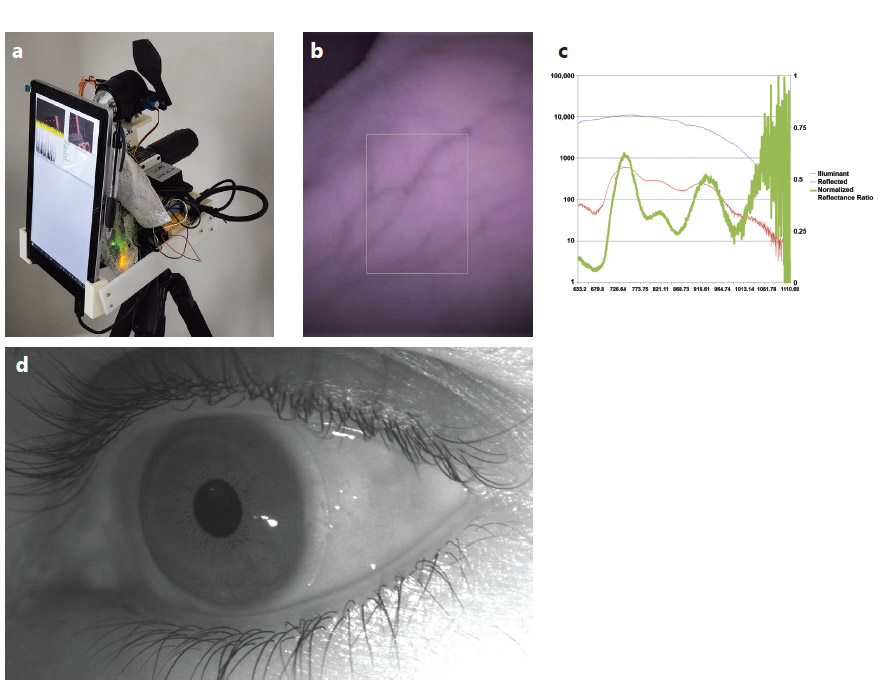
Figure 3. The first ‘foveated spectral imager’ proto-type, circa 2016 (a). A typical image displayed on the viewfinder, with the white box outlining the calibrated region of the scene from which light enters the spectrometer slit (the spectrometer’s ‘receptive field’) (b). The first successful demonstration of noncontact snapshot acquisition from afar of a spectral signature — here, of a shamrock leaf — despite the presence of ambient light, without blackout drapes or white reference standards (c). Cross polarizers were added because human skin is shiny in near-infrared (NIR), mucosal membranes are shiny even in visible light, and specular reflections obscure the spectral signature of the underlying material (d). Courtesy of ORCA Med.
NIR images of the targets were obtained by replacing the infrared-blocking filter of an inexpensive USB camera with an inexpensive longpass filter that blocked visible light. The white box in the viewfinder frame outlines the calibrated ROI from which light is projected onto the slit of a spectrometer. An inexpensive dual-core tablet computer was used for user interface, device control, data storage, and wireless networking. Photonic throughput was a bottleneck, but light from a 20-W tungsten-halogen bulb was sufficient to measure accurate spectra of leaves and human skin from a distance of several feet. Although quicker than existing methods by orders of magnitude, integration time of ~100 ms contributed to sluggish updates of the display.
Similarly, the USB 2.0 link between the imaging sensor and the computer added enough latency to induce vertigo with prolonged hand-held operation. These problems, however, have been solved with newer-generation tablet computers featuring more computing cores as well as faster buses for information transfer, such as USB 3.x and USB C.
Design achieves data reduction
The data from the foveated spectral imager is not a plane image, such as the monochrome NIR image in Figure 3. It is not a color RGB image that is functionally equivalent to three monochrome layers obtained using three different bandpass filters. Lastly, the information is not presented in a hyperspectral data cube, in which each pixel in the imaged scene is resolved into a high-resolution spectrum.
Aside from details such as compression that do not change the analysis, Figure 4 shows graphically that significant data reduction can be achieved using a hybrid system that acquires a monochrome or RGB color image while simultaneously measuring a high-resolution spectrum from the targeted ROI. An uncompressed 640- × 480-pixel NIR image of the target requires 307,200 numbers (one for each pixel). If one aims to capture a traditional RGB color image at that spatial resolution, 921,600 numbers are needed. If one wishes to acquire a hyperspectral data cube at that spatial resolution with 100 spectral bands, then 30,720,000 numbers must be generated and transmitted. In contrast, the shamrock leaf analysis was completed within a fraction of a second because only 310,272 numbers were generated and transmitted from the sensors to the processor for analysis.
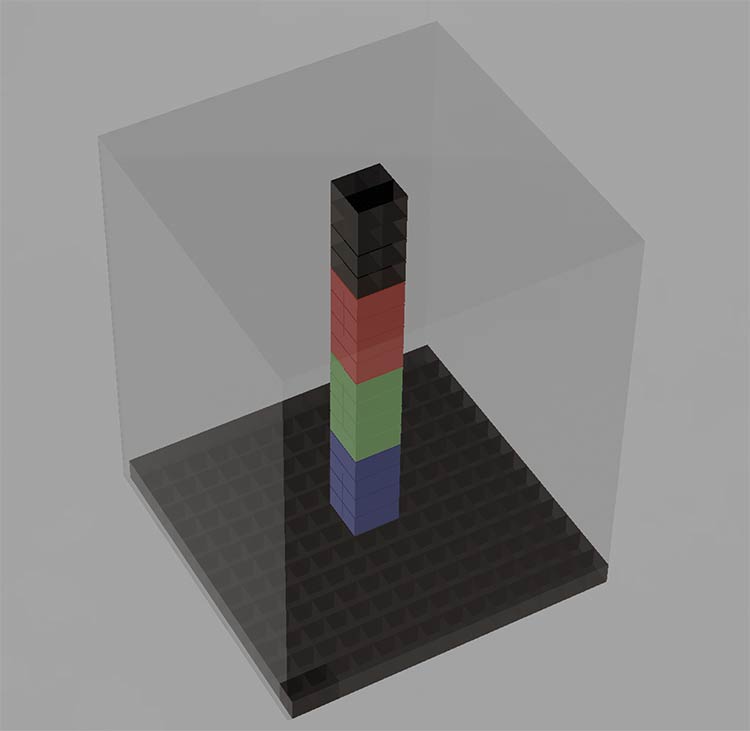
Figure 4. A pictorial representation of the mass of data — enclosed by clear volume — that does not need to be transmitted and processed if the device is aimed by the user so that the target fills the outlined region of interest (ROI) on the real-time viewfinder display.
A monochrome or color plane image is captured, along with high-resolution spectral information from the ROI. Courtesy of ORCA Med.
Each number is essentially the readout of one photodetector after one integration interval. Each number imposes some costs: time is needed to integrate the photon flux reaching the photodetector; heat is generated by analog and digital signal processing at the sensor; additional time is needed to transmit the number via an appropriate bus to the user-facing computer; time and energy are consumed by the computer to deserialize, process, and display the data; and heat is generated by the computer while processing each number. Although computing power and speed seem to grow without limits, illumination power, integration time, heat dissipation, and the energy capacity of rechargeable batteries cannot be ignored. These factors affect SWaP and hence the usability of portable medical instruments.
Clearly, improvements in photonics and computing are driving the dimensional growth in number generation. The mathematical framework of dimensionality has ranged from rank-1 tensor describing spectrally resolved light from a slit dispersed by a grating, to rank-2 tensor describing spatially resolved light focused by a foreoptic, to rank-3 tensor describing the data cube of spectrally and spatially resolved light generated by HSI.
Nevertheless, these technology improvements are not addressing the usability and tolerability issues identified decades ago. Clinicians and biomedical researchers are still reporting acquisition times of 6 to 30 s that many subjects, especially elderly ones, find difficult to tolerate. Photonic medical devices are still prone to artifact, and the quality and credibility of acquired data depends greatly on operator skill and care. Despite the clever methods developed last century to adapt spectroscopic methods to work on satellites that observe the Earth from space, clinical spectral methods often require patient contact with probes, blackout drapes, and/or white reference standards.
Perhaps real-world instruments could be designed for medical use- case scenarios with yesteryear’s optics, sensors, and computers paired with today’s readily available rechargeable battery technology. For instance, the original prototype in Figure 3 demonstrated successful measurement of a calibrated, reproducible NIR spectral signature from afar, within a fraction of a second, in the presence of ambient light, without using a white reflectance standard on the target, and without blackout drapes. It could also perform rudimentary pattern classification using stored principal components computed a priori from a labeled, curated training data set. The design requires the user to aim the camera such that the target fills the white box outlining the ROI, much as the primate visual system uses eye movements to foveate targets. Funding is currently being sought to create an optical chassis that would make the ROI user-selectable on the displayed viewfinding image using, for instance, MEMS mirror technology. Paired with an adequately fast televideo link, a telemedicine kiosk equipped with such a technology could enable physicians to perform nondestructive virtual biopsies of skin and mucosal lesions remotely.
Noninvasive bedside diagnostics
Because aggressive medical interventions inevitably pose risks and consume precious resources, they are administered only to those in need, not to everyone at risk. Unfortunately, predicting which patients will need a specific intervention and when that intervention will be needed remains a challenge. For instance, current monitoring techniques tend not to identify the onset of hemorrhagic and septic shock until vital sign abnormalities, hemodynamic deterioration, and/or multi-organ failure make it apparent. Perceptive clinicians can sometimes detect the microcirculatory changes that herald impending shock before end-organ dysfunction manifests, but the changes are subtle and can be masked by cutaneous melanin. Even in lighter-skinned patients, identifying such subtle changes requires appropriate lighting, good eyesight, as well as clinical acumen and gestalt, which can vary from clinician to clinician.
Studies during the past few years have shown that spectral imaging techniques can identify microcirculatory changes that herald impending shock. However, photonic techniques such as sublingual video microscopy remain controversial due to usability issues and the need for contact with the mucosa, which can alter the micro-
circulation under the probe unless the operator is exceedingly careful. NIR light could potentially analyze the subcutaneous microcirculation without contact, because it can travel through melanin, skin, soft tissue, and even bones.
Nevertheless, as became apparent during the COVID-19 pandemic, much work remains to fully elucidate how human skin tone variance affects photonic measurements in clinical settings. Human skin tone in the deep red and NIR wavelengths is not a simple light-to-dark function of melanin. This can be seen in plots of data collected by colleagues at NIST a decade ago, as well as with data collected using the foveated spectral imager (Figure 5). Decorrelation between visible and NIR bands means that better spectral sampling strategies may be necessary to overcome inherent limitations of dual-wavelength pulse oximetry, limitations that cannot be solved solely by diversifying the sample population used to calibrate pulse oximeters (see FDA draft guidance released Jan. 7, 2025, “Pulse Oximeters for Medical Purposes - Non-Clinical and Clinical Performance Testing, Labeling, and Premarket Submission Recommendations”).
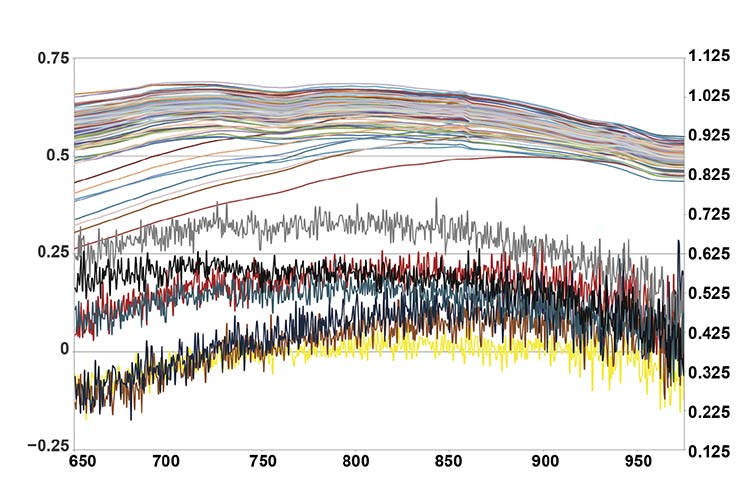
Figure 5. Reflectance spectra from a range of skin phenotypes, obtained by colleagues at NIST (top), versus the prototype (bottom). Many — but not all — traces cross at various wavelengths within the 650- to 1000-nm range. This is the wavelength range over which most photonic pulse and tissue oximeters operate. Visual assessments and objective measurements limited to the visible range cannot predict how an individual’s skin will measure in different NIR bands. This affects the reliability of pulse oximeter calibration processes, for which the FDA released updated draft guidance in January 2025. Courtesy of ORCA Med.
Evolution in design
The challenges of bringing spectroscopy to the patient’s bedside are not insurmountable. However, patients and clinicians will not fully benefit from the remarkable advancements in technology since the turn of the century — advancements that are already affecting other aspects of their lives — unless meaningful effort is invested early in the design process. Photonic medical instruments must be designed to be usable by clinicians, tolerated by patients, and calibrated accurately enough to be trusted with life-or-death decisions.
The fovea may have evolved millions of years ago, but the primate visual system still sets impressive performance benchmarks and offers valuable engineering insights. Incorporating some of the time-tested solutions found in nature may help create futureproof and versatile photonic instrumentation.
Meet the author
Rajagopal Srinivasan, M.D., Ph.D., founded ORCA Med LLC to bring modern optics, robotics, computing, and AI/ML to medicine. He has worked as a physician in the Department of Emergency Medicine at the University of Maryland School of Medicine in Baltimore; email: orcamedllc@outlook.com.
Published: September 2025