Revealing the full emission spectra of each fluorescent dye enables identification of larger numbers of cell samples from a single assay.
MING YAN AND GIL REININ, CYTEK BIOSCIENCES INC.
Flow cytometry is gaining traction as a clinical and research tool in areas such as immuno-oncology and systems biology because it enables the ability to profile a large panel of heterogeneous cells from a single sample. These rapidly growing areas of research will drive the flow cytometry analyzer market to grow to more than $1 billion by 2020.
However, conventional cytometry systems with the highest profiling capability require specialized reagents and high expertise in experimental design because of inherent limitations of the traditional optical systems they incorporate. Specifically, conventional cytometers rely on fixed bandwidth filters to isolate the fluorescence of the probe dyes, and they require a mathematical algorithm to reduce the fluorescence spillover from dyes in neighboring channels (a process called compensation).
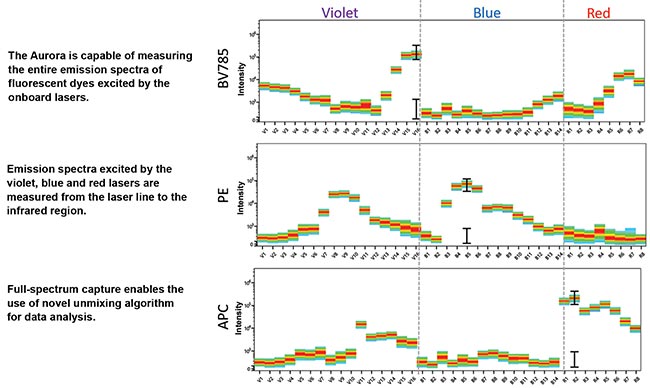
Figure 1. Up to 48 high-quantum-yield semiconductor detectors can be used to detect the full emission spectra of dyes across three lasers. Each dye has a unique spectral signature.
Further, wide fluorescence emission spectra typically limit the number of supported dyes to 14 with three excitation lasers (405 nm, 488 nm and 640 nm). Full-spectrum optical technology overcomes these limitations with the ability to detect >20 colors with only three standard excitation lasers.
Flow cytometers objectively and rapidly measure multiple characteristics of single cells (up to 35,000 cells/sec). Particular cell types are identified using fluorescent-labeled antibodies that are specific to those populations. The more fluorescent-labeled antibodies used to identify specific cell populations and subpopulations, the deeper the biological insights that can be obtained from one sample. There is a growing demand to use a greater amount of fluorescent labels for identifying more cell populations per sample.
Nowhere is the capacity to measure multiple characteristics more in demand than for immuno-oncology research, where flow cytometry is becoming a standard tool. The ability to profile several cell subsets in a single assay of whole blood can be used to evaluate IO therapies such as checkpoint inhibitors, adoptive cell therapies and cancer vaccines. Among the cell populations that flow-
cytometry-based immunophenotyping can profile in a single assay are several well suited to IO research such as naive CD4+ and CD8+ T cells, central and effector memory T cells, regulatory T cells, B cell subsets, NK cells, monocytes/macrophages and dendritic cell subsets.
With a conventional flow cytometer, fluorescent-labeled particles (usually mouse or human cells) in single-cell suspension travel through a sample line. The labeled particles are hydrodynamically focused in a flow cell to pass single file through focused laser beam spots with wavelengths that excite the dyes. The emitted fluorescent light is collected at 90 degrees through a fluorescence objective lens and directed to specific photomultiplier tube detectors (PMTs) via a system of mirrors and filters. There is one PMT for each dye detected.
Excessive overlap of emission spectra results with a conventional flow cytometer if too many dyes are excited by the same laser, making it difficult or impossible to resolve cell populations from each other. For typical systems, this limits the number of dyes that can be excited by each laser to three to five colors.
Even when using fewer dyes, careful consideration must be given to selecting bandpass filters (residing in front of each PMT). The filters must have a band that is wide enough to capture the dye peak emission without losing photons of light (loss in sensitivity), but narrow enough to minimize the spillover from neighboring dyes. This compromise limits the ability of conventional cytometer optical designs to identify multiple cell populations with more fluorescent-labeled antibodies without having to add more lasers and more PMTs.
Full-spectrum optical cytometry reveals the full emission spectrum of each dye using multiple detectors. Specifically, up to 16 high-quantum-yield semiconductor detectors per laser are used to detect fluorescence emission from the excitation wavelength to near-infrared (NIR). Each dye is excited by three lasers, and its full emission spectrum is detected by up to 48 detectors. Each dye also has a unique spectral signature, and software included with the system uses a mathematical algorithm to differentiate all the fluorescent signatures in a sample with cells labeled with multiple dyes, a process called unmixing (Figure 1).
A highly sensitive system, such as the Aurora developed by Cytek Biosciences, is key for detecting dim staining populations using this approach. Each detector in the system’s optical arrays has unprecedented sensitivity given its narrow emission band. To demonstrate the sensitivity of each detector, researchers ran six hard-dyed calibration beads of varying dye intensity from bright to dim. The cytometer system can easily detect all six intensities using the dye emission peak channel despite the narrow band (571/23) (Figure 2).
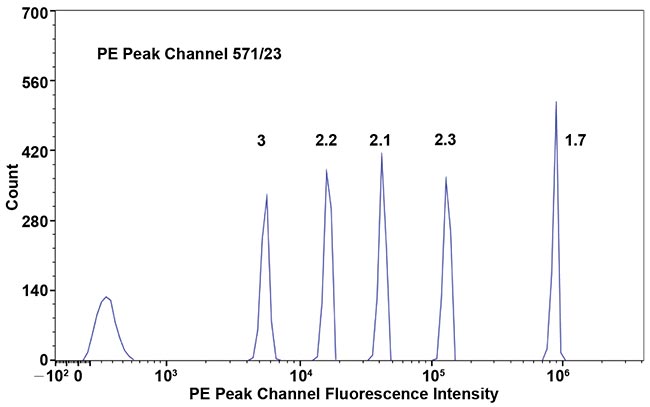
Figure 2. The histogram of 6-peak fluorescence calibration particles; the coefficient of variation of each particle is 1.7 percent, 2.3 percent, 2.1 percent, 2.2 percent and 3 percent from brightest peak to second dimmest peak.
The coefficient of variation (CV) for all bead peaks is within 3 percent from the brightest peak to second dimmest peak. In contrast, when the same beads are run on a conventional PMT-based cytometer, the CV of the second dimmest peak is typically three times greater. This means that each of the system’s 48 detectors has a photon detection efficiency that is about 10 times that of conventional cytometer PMT detector using a filter with the same bandwidth.
The workflow for identifying cell populations with the new technology is straightforward. Each dye emission spectrum is recorded as a reference and used to spectrally unmix dye combined emission spectra collected from a sample, thus identifying specific cell populations within (Figure 3).
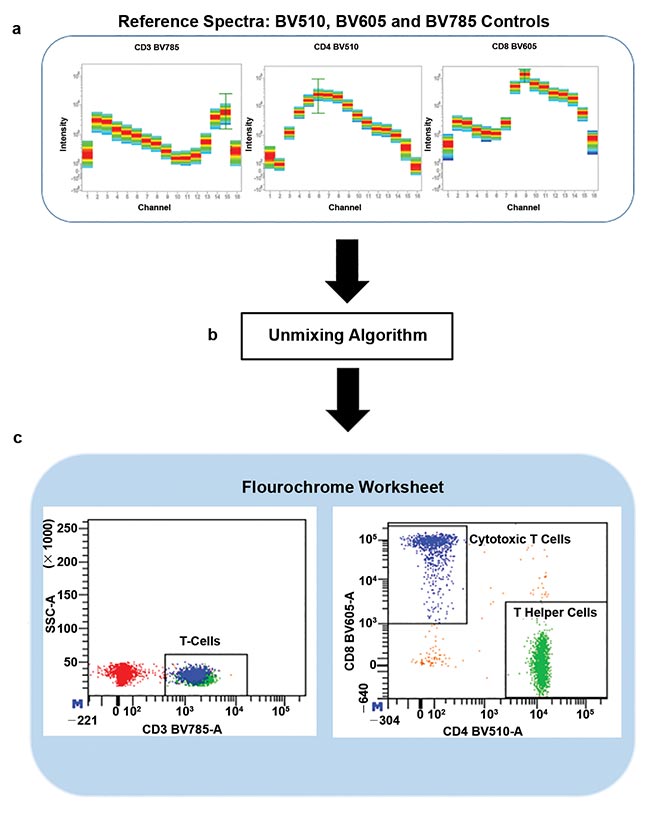
Figure 3. Individual dye spectra are recorded as reference controls and multicolor samples are recorded (a). Multicolor samples are then unmixed with reference dye spectra to extract the information of each dye and the identification of cell populations (b, c).
Utilizing efficient flattop laser excitation beam profiles and high quantum yield semiconductor detectors, the system can unmix highly overlapping dyes, even when co-labeling single cells.
The dyes BV711 and Qdot700 (~700 nm) could never be used together on a conventional flow cytometer because they would use the same detector and filter for detection. However, the full emission spectral signature of each dye across three lasers is unique, and therefore can easily be discerned from the others using this flow cytometer system (Figure 4).
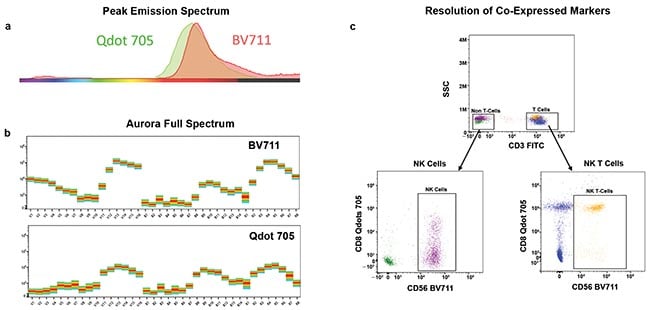
Figure 4. The peak emission spectra of the dyes Qdot 705 and BV711 highly overlap and cannot be used together on a conventional flow cytometer (a). However, these two dyes have distinct signatures, and because of this, they can be used in combination with full-spectrum cytometry (b). This means these dyes can be used in combination to identify cell populations of interest such as T cells and non-T cells that co-express CD8 and CD56 (c). The new technology can fully resolve cells that express one or both markers at different levels.
To demonstrate the system capabilities, a 20-color immunophenotyping assay was designed that identifies and characterizes different circulating cell subsets in human blood (Figure 5). The multicolor panel incorporates commonly available dyes based on violet, blue and red laser excitation. Many of these dyes have highly overlapping peak emission spectra, but the system produced high-quality data with tight population clusters and the ability to resolve dim populations without interference from spectral overlap.
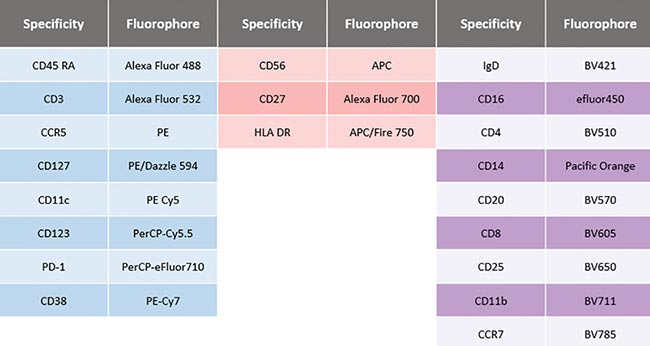
Figure 5. A 20-color combination immunophenotyping assay. Three lasers were used to excite 20 dyes, many with highly overlapping peak emission spectra. Each dye in the panel was used to identify specific cell populations in circulating human blood of a single sample.
In summary, unlike a conventional cytometer that is limited to one dye per detector, full-spectrum cytometers use the entire emission spectrum from multiple laser excitation and a spectral unmixing algorithm to discern dyes in a multicolor sample, even those with highly overlapping peak emission spectra. This optical design offers the researcher deeper biological insights because of a wider choice of fluorescent labeled dyes that can be used to identify more cell populations of interest in a single sample, compared to a conventional flow cytometer with the same lasers onboard.
Meet the authors
Ming Yan, Ph.D., is chief technology officer at Cytek Biosciences in Fremont, Calif. He received his Ph.D. in biophysics and has worked in biodetection and photonics for more than 20 years at companies such as Bell Labs, Lawrence Livermore National Labs and BD Biosciences. Ming is a pioneer in flow cytometer instrumentation and standardization; email: [email protected]. Gil Reinin is director of marketing at Cytek Biosciences. He has more than 27 years of flow cytometry experience, including roles as a flow core lab manager and, for the past 10 years, as a global product manager and marketing director; email: [email protected].
Reference
1. H.E. Kohrt et al. (2016). Immunodynamics: A cancer immunotherapy trials network review of immune monitoring in immuno-oncology clinical trials. Journal for Immunotherapy of Cancer, 4:15. doi:10.1186/s40425-016-0118-0.