Dr. Adam Wise and David Riley, McPherson Inc.
Photochemical deposition of organic films is a significant cause of performance loss in ultraviolet systems; when feasible, it can be reduced or eliminated with inert gas purging.
Ultraviolet photons are highly energetic – enough to break bonds and reorganize molecules. They can efficiently reduce silver salts in photographic emulsions and damage DNA by dimerizing thymine bases. UV spectroscopy yields insight into high-energy processes in planetary atmospheres, stars and fusion reactors. Also, UV light’s short wavelength means less diffraction, enabling higher-resolution microscopes and lithography systems. Extreme UV (EUV, 10-120 nm) lithography is expected to revolutionize microelectronics by pushing transistor size nearly to the atomic limit.
But making and measuring light below 200 nm demands special experimental considerations and presents a unique set of challenges.1 EUV measurements require high-vacuum chambers, expensive all-reflective optics and exotic windowless light sources – virtually every material is completely opaque to these wildly energetic photons.
For far-UV measurements (120-200 nm), demands are less stringent: Fluoride refractive optics replace silica, and the vacuum-absorbing components of air (oxygen, water vapor, carbon dioxide) must be displaced or removed from the experimental apparatus. However, the high energy that makes UV light so interesting can cause a serious problem that plagues even the best and most precise UV-measurement systems – the photochemical formation of organic films on optical surfaces with subsequent degradation of performance.2
Photochemical film formation is the result of organic contaminants photopolymerizing on optical surfaces.2 Even in superclean vacuum systems, a small amount of residual contamination exists – outgassing from chamber walls, samples and perhaps the errant fingerprint. Over time, these films cause increasing, wavelength-dependent loss of performance. Further, the growth rate and optical properties of these films depend strongly on the type and quantity of contaminants, and on the intensity and wavelength of the UV light sources.3
Degradation due to photochemical film deposition may be reversed by cleaning the optics,4 but for delicate surfaces such as gratings, this simply may not be possible. Furthermore, the process of stripping and recoating mirrors, along with repolishing lenses, is expensive and time-consuming and takes the instrument offline.
Millions of dollars have been spent in search of solutions to the film-formation problem – what is an annoyance for a ground-based instrument is a death sentence for one in space, which of course cannot be readily serviced. Engineering solutions include in situ UV-ozone cleaning,5 cryogen shrouding of optics6 and a laundry list of other techniques (heated optics, in situ mirror recoating, ablation of contaminants, etc.), absolutely none of which are both effective and inexpensive. For superlow-drift spectroscopic experiments or process-critical QC instruments, this presents a serious problem.
To control the growth of organic films in UV instruments, UV measurements can be made under an inert gas atmosphere (typically nitrogen) rather than under vacuum, if at all possible. Just as argon gas reduces evaporation of the tungsten filament in incandescent bulbs, inert gas fill in UV instruments reduces contaminant desorption and photopolymerization, often without otherwise decreasing optical performance. However, purge gas will inevitably absorb UV light, decreasing power. But by how much? And is light absorption by purge gas a practical concern for your application?
To compare the relative performance of vacuum and nitrogen purging in the far-UV, technicians carried out tests using a McPherson 234/302 vacuum spectrometer, a Model 632 deuterium lamp light source and a Model 658 photomultiplier tube detector. A typical instrument is shown in Figure 1.
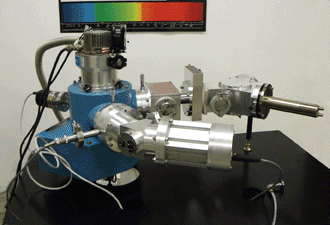
Figure 1. A McPherson 234/302 vacuum spectrometer/monochromator with deuterium light source (front arm) and photomultiplier tube detector (rear arm) are shown, as well as reflective condensers and vacuum equipment.
For both purged and vacuum measurements, emission spectra of the deuterium lamp were recorded at set intervals. Between spectra, emission at a single wavelength (160 nm) was monitored over time. Comparison of initial N2-purged and vacuum spectra yields a measure of absorption by the nitrogen gas, shown in Figure 2.
The nitrogen absorption bands in Figure 2 are strong but narrow, overall blocking relatively little light from the deuterium source, especially above 145 nm. For most far-UV illumination applications, N2 purge will not cause performance issues. Even for line sources such as krypton lamps, the low likelihood of overlap with the narrow N2 bands may make high-resolution spectroscopy in the far-UV possible with a gas-purged instrument. A change of purge gas (e.g., to slightly more expensive argon) is also possible if spectral overlap is an issue.
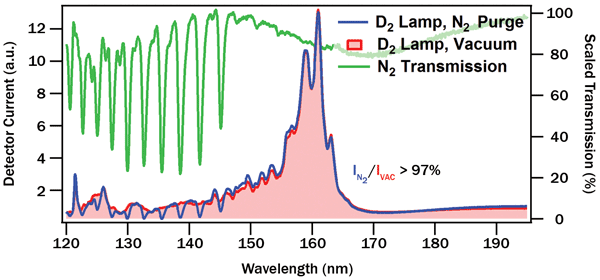
Figure 2. Comparison of deuterium emission spectra with spectrometer under vacuum (red) and N2 purge (blue). Ratio of the two spectra yields nitrogen absorption (green).
The advantage of a purged measurement system for long-term stability becomes apparent when examining the time dependence of the transmission loss (Figure 3). Measurements under vacuum show a quasiexponential, irreversible decay in transmission, with relatively fast initial loss followed by slower but steady degradation. Identical measurements carried out with fresh optics under nitrogen purge show small random fluctuations about a mean value (perhaps because of slightly varying gas density), with no overall long-term loss trend. For quality control where samples must be measured with high repeatability over weeks or months, a purged system becomes the clear winner. On the other hand, for spectroscopy or QC measurements that demand both high stability and high time resolution (<1 min.) measurements, vacuum or more careful regulation of purge pressure may be preferable.
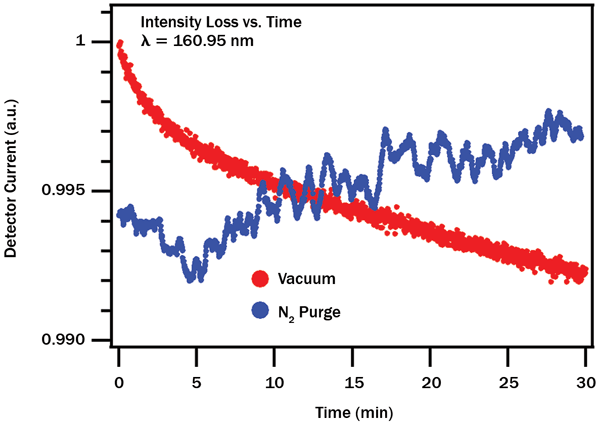
Figure 3. Decay of transmission at 160.95 nm over time. Vacuum (red) shows irreversible, quasiexponential degradation, whereas nitrogen purge (blue) displays random fluctuations about a mean value with little long-range drift.
The end result of three days of continuous use can be seen in Figure 4. Transmission spectra of the full optical train after significant UV exposure are compared with initially measured spectra taken with fresh optics, and the ratio of these measurements allows us to quantify wavelength-specific losses. Measurements under nitrogen purge show little loss over time at any wavelength, while measurements under high vacuum show transmission losses proportional to light energy (inversely proportional to wavelength). After sufficient time, complete loss of shorter-wavelength emission (critically, the Lyman-α band at ~121.6 nm) is inevitable.
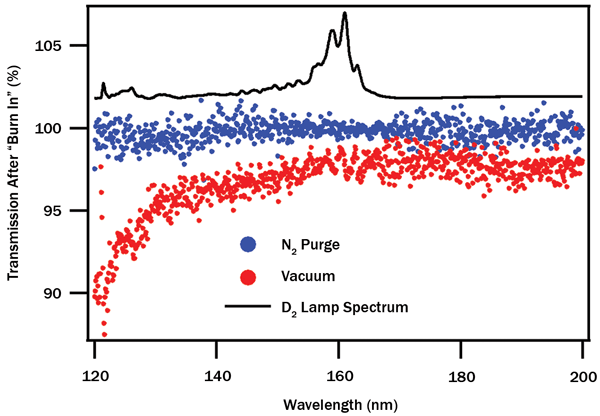
Figure 4. Wavelength dependence of transmission loss after three-day measurement period. N2 purge (blue) shows no significant change, while measurement under vacuum (red) shows significant wavelength-dependent transmission loss, up to 10 percent in the Lyman-α region. Deuterium lamp spectrum superimposed.
If vacuum measurements are unavoidable, other steps may be taken to mitigate organic film formation. Interestingly, we have found that the materials used to make UV mirrors and gratings can have a large effect on system performance over time. A short test of two gratings – one with an Al/MgF2 reflecting surface and one with platinum – reveals a clear trend, as shown in Figure 5.
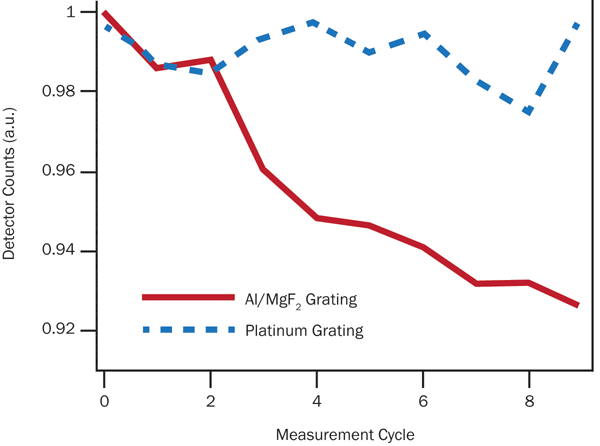
Figure 5. Over repeated scans of the Lyman-α lines from a highly stable deuterium lamp (McPherson Model 632), a platinum diffraction grating appears to show relatively little wear when contrasted with Al/MgF2.
Despite the rich literature on photochemical film formation, we surprisingly cannot find published work confirming our relatively anecdotal measurements of the effect of substrate surface composition on film formation mechanisms or rates.
Meet the authors
Dr. Adam Wise is the director of R&D at McPherson Inc.; email: [email protected]. David Riley is an engineering technician at McPherson Inc.; email: [email protected].
References
1. J.A.R. Samson (1967). Techniques of Vacuum Ultraviolet Spectroscopy (Pure and Applied Optics). John Wiley & Sons.
2. V.B.E. Thomsen et al (1997). Special supplement, International Spectroscopy Laboratory: Vacuumless spectrochemistry in the vacuum ultraviolet. Int Lab, Vol. 27, pp. 9A-9F.
3. T.B. Stewart et al (1989). Absolute rates of vacuum-ultraviolet photochemical deposition of organic films. J Phys Chem-US, Vol. 93, pp. 2393-2400.
4. B. Azmoun et al (2010). A study of the performance of the gas transmission monitor of the PHENIX Hadron Blind Detector. IEEE Nuclear Science Symposium Conference Record, pp. 1931-1934, doi: 10.1109/NSSMIC.2010.5874111.
5. M.E. Frink et al (Dec. 18, 1992). Evaluation of the ultraviolet/ozone technique for on-orbit removal of photolyzed molecular contamination from optical surfaces. Proc SPIE, pp. 286-294, doi: 10.1117/12.140739.
6. Z. Zhang et al (April 2012). High-accuracy irradiance calibration of space UV remote sensing instrument (SURSI) from 160 to 250 nm in vacuum using a liquid nitrogen cooled device. Meas Sci Technol, Vol. 23,
p. 045801.