The technology assists researchers’ efforts to track the potency of pharmaceuticals and genetic interactions.
MERRILEE THOMAS, MONTANA MOLECULAR, CAYLA STIFLER, MIDDLETON SPECTRAL VISION, AND SLATER KIRK, RESONON INC.
Hyperspectral imagers provide an image that produces a detailed spectrum for every pixel, capturing very minute details in a sample. Typically, this technology has been used to measure the spectral reflectance of materials such as agricultural products or components of biological tissue. It has the capability to produce a color image with a far greater color resolution than conventional imaging methods. With spectral channels from the tens to low hundreds, objects or materials are far more distinguishable than those generated by standard color cameras or with a bandpass filter that is used to block unwanted frequencies of light.
In this context, hyperspectral imaging can be used to measure fluorescence, thereby using the high spectral resolution to distinguish between fluorescent signals within a sample or a tissue that would be difficult or impossible to identify using other approaches. Two recent case studies showed the utility of this technology in a life sciences and biomedical context.
Recently, fluorescent hyperspectral imaging was used to evolve and improve red fluorescent proteins, which are typically used to monitor biological processes. For example, they are important tools in drug discovery, in which they allow new drugs that activate signaling pathways in living cells to be found1. Fluorescent proteins can evolve through random mutagenesis and selection to improve fluorescent properties. However, any one mutation is likely to shift the absorption and emission properties by ~1 nm, so researchers sought to determine whether the high resolution of hyperspectral imaging would enable more rapid tuning of red fluorescent protein properties.
After only four successive mutations, new fluorescent proteins with favorable properties were found and isolated. Proteins were identified that fold — taking on their identifiable, 3D structure — and fluoresce rapidly at a typical body temperature of 37 °C. Mutants with shifted absorption and emission properties were readily apparent. The sensitivity of hyperspectral imaging dramatically increases the speed and ease with which a fluorescent protein can be tuned.
At the same time, hyperspectral fluorescence has been applied to the monitoring of certain drug formulations for composition and for uniform distribution of active pharmaceutical ingredients and inactive substances, also known as excipients.
Fluorescent protein evolution
Historically, the first fluorescent protein to be purified and cloned by scientists came from the jellyfish called Aequorea victoria and was a vivid green color2. Osamu Shimomura, Martin Chalfie, and Roger Tsien were awarded the Nobel Prize in Chemistry in 2008 for their roles in the discovery. The protein was quickly adopted for many uses, such as the visualization of specific cell types in the body. This protein has been optimized through mutagenesis to create cyan and yellow versions, which capture additional physiological processes, as well as versions with long Stokes shifts that are ideal for multiplexed imaging3.
While these green fluorescent protein (GFP)-based tools are remarkably powerful, they absorb and emit in wavelengths that are easily scattered, limiting their usefulness in thick tissues, such as brain tissue. Red fluorescence, on the other hand, is less susceptible to scattering and offers another channel that is quite distinct from GFP. Though it is promising in endeavors such as imaging deeply within brain tissue, the red proteins, which typically derive from cold water corals, often fold poorly at body temperature, affecting their inherent fluorescence. Therefore, optimizing red fluorescent proteins to fold more effectively is a useful endeavor for researchers and developers.
For example, the sequence encoding the commonly used mCherry red fluorescent protein was cloned into an Escherichia coli expression plasmid and was the parent protein. Error-prone polymerase chain reaction — the introduction of random mutations into a segment of DNA that is too long to be chemically synthesized — and gene shuffling were subsequently used to create libraries of mutant offspring, in which each colony on a plate was a different mutant. Thousands of colonies were on several plates. These plates were then imaged in the Resonon Bio-LIF (laser induced fluorescence) hyperspectral fluorescent imager at ~2 min per plate, taking an average of 20 min to image tens of thousands of colonies (Figure 1).
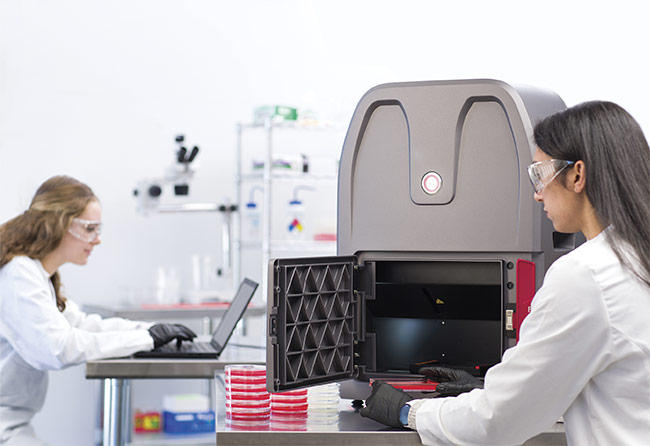
Figure 1. The Resonon Bio-LIF (laser induced fluorescence) system that is designed to record fluorescent images from standard petri dishes. Courtesy of Resonon.
The system included a high-resolution hyperspectral imager with <2 nm resolution, a laser line source, a scanning system, an enclosure to eliminate stray light, and data acquisition software. A reference plate with uniform fluorescence is incorporated into the sample tray and is scanned with each sample to correct the data for any variation in laser brightness along the laser line.
Following the scanning, a peak-finding algorithm was used to locate fluorescent colonies with shifted fluorescence. An image of the petri dish was generated with false coloring to show the colonies with spectral shifts (Figure 2). The colonies’ spectral signature could also be examined using an inspector tool that enables viewing of the emission spectra of any selected pixel or group of pixels. In the first round of evolution, these tools quickly revealed mutant colonies with slightly shifted emission properties that were readily discernible due to the high-resolution spectra.

Figure 2. Image of fluorescent colonies in a tray (left). The enlarged image (right) shows colonies falsely colored to match their spectral peak. Very small peak shifts are easily distinguished. Courtesy of Resonon and Montana Molecular.
The first round of mutants with slightly shifted emission curves was pooled and a second round of mutagenesis produced more plates with tens of thousands of colonies to seek additional evolution. The emission properties began to diverge more significantly, and two additional rounds of mutagenesis and hyperspectral imaging quickly produced a spread of emission peaks between 593 and 617 nm (Figure 3).
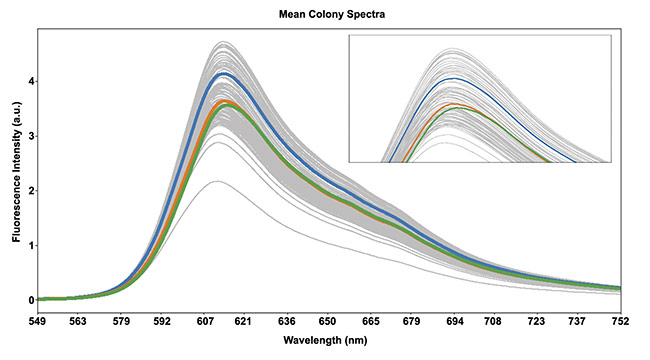
Figure 3. Fluorescent spectra from typical colonies. Spectral curves from three colonies with different peaks are highlighted. Courtesy of Resonon and
Montana Molecular.
The top six proteins from this screen were moved into BacMam viruses, which express genes in human cells that do not have toxicity4. Results demonstrated that the hyperspectral imager allowed for it to quickly identify new red proteins that were brighter in human cells, matured significantly faster, and had red-shifted properties that allowed for them to be spectrally distinct from the green proteins. Continuing to refine this method will enable additional rounds of mutation to be used to create a new rainbow of tools for diagnostics and life sciences research.
Capturing drug potency
Hyperspectral fluorescence has also been used for the monitoring of the composition, concentration, and distribution of active and inactive pharmaceutical ingredients to ensure the safety, efficacy, and uniformity of their products for consumers; this succeeds where other nondestructive methods fail. In recent years, companies have sought to shrink the size of tablets, capsules, and softgels while simultaneously decreasing the overall concentrations. However, the small size and low concentrations are difficult to detect with typical nondestructive analysis of these formulations, such as near-infrared reflectance5 or transmission Raman6.
In contrast, fluorescence imaging is known to have good sensitivity down to low concentrations, with the main pharmaceutical application using discrete wavelength excitation and emission detection associated with specific ingredients7. Hyperspectral imaging is an excellent choice for detecting fluorescence from low concentrations, because increasing either the excitation light intensity or the integration time to collect more photons per measurement increases the strength of the fluorescent signal.
However, solid pills often contain more than one ingredient that fluoresces at the same excitation wavelength and is therefore an analytic tool that can split an overall fluorescence signal into its pure components to monitor the composition and distribution of multiple ingredients simultaneously. Hyperspectral imaging is also particularly good for this application because the spectral resolution is high enough that multivariate curve resolution can easily separate out the different fluorescent signals from a single fluorescence curve.
To demonstrate the capabilities of hyperspectral fluorescence imaging in combination with multivariate curve resolution of the images, prescription and over-the-counter drugs were scanned. Different formulations of fluorescence signatures that were normalized to unity were captured in this study (Figure 4). The original intensities varied by a factor of ~100, highlighting the available sensitivity to a wide range of fluorescent signals. This capability is particularly useful when simultaneously measuring fluorophores that have vastly different fluorescent intensities.
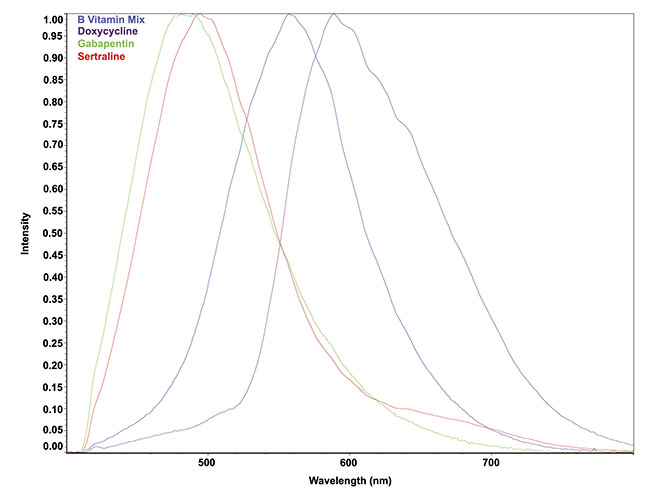
Figure 4. Fluorescence signatures of formulations using 405-nm excitation. The signals were normalized to unity for comparison. The intensity of the original fluorescence signals varied by about 100:1. Courtesy of Middleton Spectral Vision.
Life sciences research
The capability of hyperspectral fluorescence imaging to identify and capture multiple fluorophores can be useful when imaging cells or organisms labeled with multiple fluorescent tags that also contain native fluorescence. Hyperspectral imaging can easily detect the different fluorescence labels and autofluorescence, and, with proper calibration and post processing, can detect a quantitative amount of each fluorophore in a location. Figure 5 shows poplar tree (Populus trichocarpa) leaf cuttings with an inserted gene of interest tagged with GFP and a different protein tagged with DsRed imaged with a high-throughput macroPhor array hyperspectral fluorescence system provided by Middleton Spectral Vision. Hundreds of petri dishes were periodically measured with the treated samples; without opening the seal, 21 dishes were measured at a time8.
The false color image in Figure 5 shows where the GFP (green), DsRed (blue), and chlorophyll autofluorescence (red) are localized as well as the relative brightness of each color. Multivariate curve resolution analysis software and purpose-built Python software were used to identify and then quantify the amount of different fluorescing components at each location. While the example in Figure 5 shows plant cuttings, hyperspectral imaging with the macroPhor array can analyze fluorophores in model systems that are more relevant to biomedical research, such as yeast cells or stem cells. The ability to quantitatively measure multiple fluorophores and autofluorescence with sophisticated data analysis tools to extract the maximum information from the resulting data cubes expedites the time it takes to perform experiments containing multiple fluorophores.
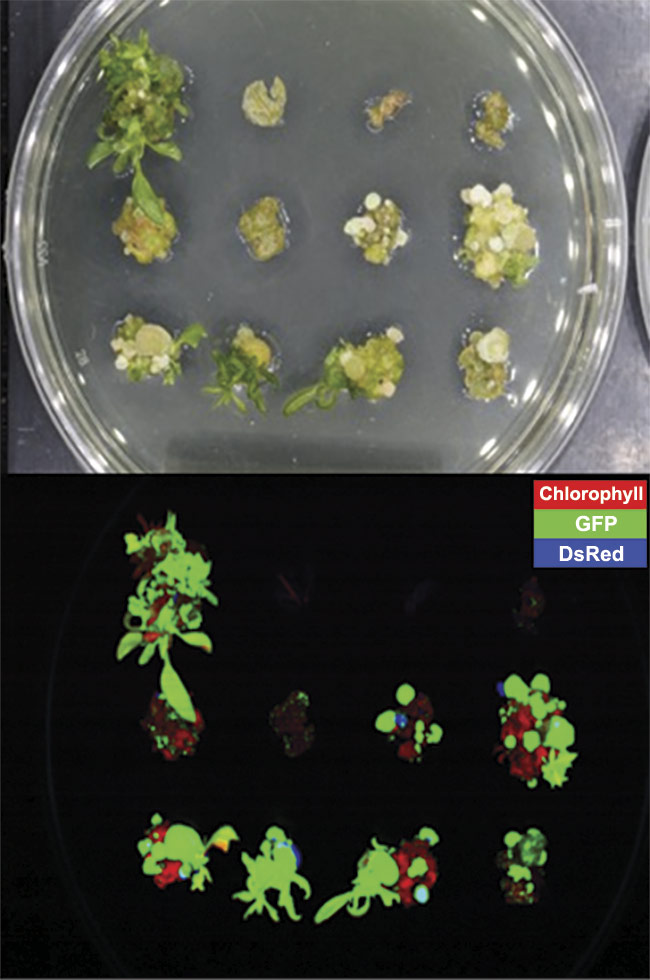
Figure 5. Early-stage development of poplar tree leaf cuttings treated with Agrobacterium. The sealed petri dish was measured using 405-nm excitation hyperspectral fluorescence (top) and the resulting false color after analysis (bottom). Courtesy of Middleton Spectral Vision.
In summary, fluorescence hyperspectral imaging provides another tool for analysis in biomedical research. It has already been demonstrated for quality control of pharmaceuticals, fluorophore multiplexing, and more recently, in the evolution of fluorescent proteins. Given the improvements to the mCherry protein and its potential for use in a variety of experiments, there are compelling reasons to continue to evolve this protein to optimize its brightness and its folding, and to shift its absorption and emission to further red. Significantly better red proteins, and better biosensors built with these red proteins, will have an impact on the ways in which we image activity in dense tissue such as the brain, potentially fueling a solution to a major goal of the NIH BRAIN initiative.
Meet the authors
Merrilee Thomas is a research associate at Montana Molecular, where she has been working on building better red proteins and biosensors. Merrilee completed her Ph.D. work at Montana State University, and she did postdoctoral work at Yale on the neural basis of addiction; email: [email protected].
Cayla Stifler is senior scientist at Middleton Spectral Vision, where she has helped develop and deploy novel hyperspectral imaging systems and complementary software for a wide range of applications; email: [email protected].
Slater Kirk is optical designer at Resonon and specializes in the development of hyperspectral imagers, including the Bio-LIF system; email: [email protected].
Acknowledgments
The authors would like to thank Rand Swanson at Resonon, Thom Hughes at Montana Molecular, and Gabor Kemeny for their contributions to this article.
References
1. S.R.J. Hoare and T.E. Hughes. (2021). Biosensor assays for measuring the kinetics of G-protein and arrestin-mediated signaling in live cells. In S. Markossian et al. (eds.), Assay Guidance Manual. Eli Lilly & Company and the National Center for Advancing Translational Sciences.
2. J. Marshall et al. (1995). The jellyfish green fluorescent protein: a new tool for studying ion channel expression and function. Neuron, Vol. 14, No. 2, pp. 211-215.
3. Y. Guan et al. (2015). Live-cell multiphoton fluorescence correlation spectroscopy with an improved large Stokes shift fluorescent protein. Mol Biol Cell, Vol. 26, No. 11,
pp. 2054-2066.
4. T.A. Kost et al. (2007). Implementation of BacMam virus gene delivery technology in a drug discovery setting. Drug Discovery Today, Vol. 12, No. 9-10, pp. 396-403.
5. M. Manley. (2004). Near-infrared spectroscopy and hyperspectral imaging: non-destructive analysis of biological materials. Chem Soc Rev, Vol. 43, No. 24, pp. 8200-8214.
6. J. Johansson et al. (2007). Quantitative transmission Raman spectroscopy of pharmaceutical tablets and capsules. Appl Spectrosc, Vol. 61, No. 11, pp.1211-1218.
7. Y. Wu et al. (2019). Activatable fluorescence imaging and targeted drug delivery via extracellular vesicle-like porous coordination polymer nanoparticles. Anal Chem, Vol. 91, No. 21, pp. 14036-14042.
8. J. Yuan et al. (2022). Robust high-throughput phenotyping with deep segmentation enabled by a web-based annotator. Plant Phenomics, Vol. 2022.