Researchers can now exploit interference of correlated photons to perform materials characterization in the IR range using accessible visible-light optics.
ANNA PATEROVA, HONGZHI YANG, AND LEONID KRIVITSKY, INSTITUTE OF MATERIALS RESEARCH AND ENGINEERING, SINGAPORE, A*STAR
IR instruments are indispensable tools for material analysis, environmental sensing, and homeland security. Through decades of development and commercialization, one common and significant limitation has been the weak efficiency of IR optical devices compared to their visible counterparts. IR components such as light sources, photodetectors, and cameras are also bulkier and costlier.
A new approach to IR metrology, however, uses common optical components for the visible range. The technique is based on nonlinear interference of correlated photons, in which information about the photon in the IR range is inferred from the measurement of its correlated photon in the visible range. Applications for spectroscopy and optical coherent tomography (OCT) are discussed in this article.
IR optical instruments
IR optical instruments have come a long way over the years, moving from laboratory toys to mature product lines that have been successfully adopted by multiple
industries. IR spectrometers, for example, serve as primary tools for material characterization in the petrochemical, biomedical, and pharmaceutical industries. IR
imaging instruments, such as OCT scanners, are widely used in ophthalmology, cardiology, and defectoscopy.
Despite continual development, challenges remain with IR components’ limited performance and high cost. One way to circumvent these challenges leverages the effects of quantum and nonlinear optics, which allow the conversion of IR light to a detection-friendly or visible wavelength.
One early example of this approach is upconversion spectroscopy, introduced by
Edwin J. Heilweil in the 1980s1. The method uses the cascaded frequency mixing of the laser light in nonlinear crystals, first to obtain the IR probing beam and then to upconvert it back into the visible. A similar approach has been recently
realized for IR OCT, in which the IR
light source was upconverted for efficient detection with visible-light detectors2.
Although these methods eliminate the need for IR detectors, they still require the use of tunable lasers, along with complex optical trains and detection systems.
A new approach to IR measurements, however, is based on the interference of frequency-correlated photons. The approach allows extracting information about the sample’s response to IR photons by measuring the interference of visible photons. Because light sources and detectors for visible light are well developed, the method holds promise as a cost-efficient alternative to conventional IR metrology.
Details of the method
The method is based on the nonlinear interference of photons generated via the process of spontaneous parametric downconversion (SPDC). In SPDC, the pump photon p decays in a nonlinear crystal into a pair of correlated photons, referred to as signal s and idler i, following momentum and energy conservation (Figure 1a). Wavelengths of signal and idler photons can be set in the visible and IR ranges, respectively, by choosing appropriate crystal parameters and pump wavelength. Active wavelength tuning of downconverted photons is achieved by varying the crystal orientation and the crystal temperature.
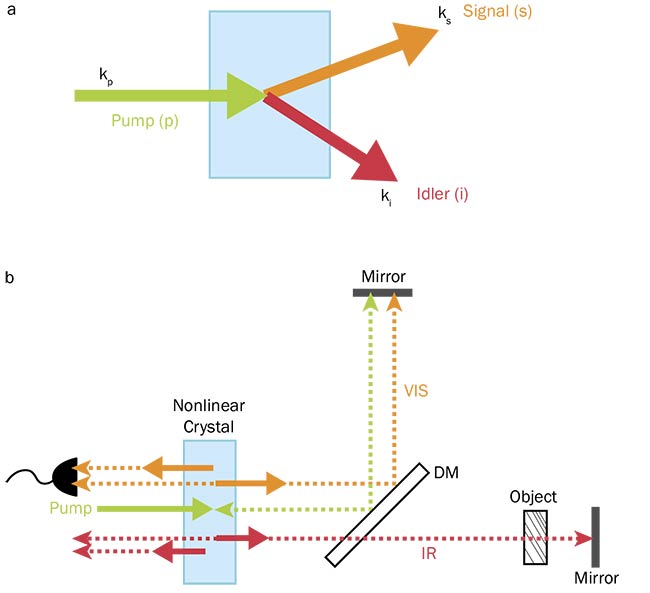
Figure 1. Nonlinear crystal produces signal and idler photons in the visible and IR ranges (a). With a nonlinear interferometer, downconverted photons are emitted collinearly, then split by a DM and reflected to the crystal. The returning pump generates another pair of photons. The intensity modulation of signal photons is detected (b). Courtesy of the Institute of Materials Research.
The optical configuration resembles a conventional Michelson interferometer. Signal and idler photons, generated in the crystal, propagate collinearly with the pump beam and then split on a dichroic beamsplitter (Figure 1b). Mirrors in each arm reflect the photons into the crystal, and the returning pump generates another pair of photons. In their seminal work, Leonard Mandel and co-workers showed that the indistinguishability between the pairs created in the first and the second pass of the pump through the nonlinear crystal results in the modulation of the intensity of the signal beam3. This modulation depends on the amplitudes and phases of all three photons in the interferometer: the signal, the idler, and the pump. This opens a possibility to characterize samples at the frequency of idler (IR) photons by measuring the intensity modulation of signal (visible) photons.
Assuming a sample under study is placed in the path of idler photons, then the intensity of signal photons is given by4:

where μ(Δt) is the normalized first-order correlation function of the SPDC, τi is the complex amplitude transmission of the idler photons, and φp,s,i are the phases of the pump, signal, and idler photons, respectively. The first term (Equation 1) describes the background intensity I0 and the second term the modulation (interference) term. The visibility (contrast) of the intensity modulation is given by:
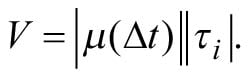
Hence, one can infer the transmission and the dispersion properties of the sample at the frequency of idler photons from measuring the intensity modulation Is of the signal photons.
Experiments
This technique has been demonstrated for IR spectroscopy and OCT4,5. A continuous-wave laser (532 nm) pumps a periodically poled lithium niobate crystal (PPLN) to generate the SPDC photons (Figure 2). Dichroic mirror DM2 splits visible and IR photons into two arms of the interferometer, and mirrors Ms and Mi reflect the photons to the crystal. The reflected pump beam generates another pair of SPDC photons. The intensity modulation of the signal photons is detected by an avalanche photodiode or CCD camera, both operating in the visible region. Mirror Ms is mounted on a translation stage to balance the optical path and to scan the phase.
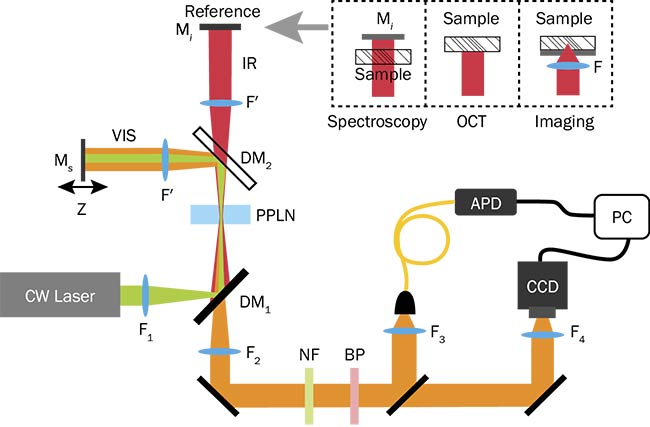
Figure 2. SPDC photons, generated in the PPLN crystal, are split by the dichroic mirror DM2 and reflected to the crystal by mirrors Ms,i. The sample is probed by idler photons. The returning pump generates another pair of photons. The intensity of signal photons is detected using the APD (avalanche photodiode) or a CCD camera. NF: notch filter; BP: bandpass filter. Adapted from references 4 and 5. Courtesy of the Institute of Materials Research.
IR spectroscopy
The sample is placed in the path of IR photons immediately before the mirror Mi. Idler photons propagate twice through the sample, and the visibility of the interference depends on the square of the amplitude transmission coefficient:

The optical path length of signal photons is scanned and the interference envelope is recorded (Figure 3a), and then the visibility of the fringes with and without the sample is measured. The absorption coefficient of the sample is inferred from the visibility ratio. All at once, from the shift of the interference envelope, the refractive index of the sample is measured. Results obtained for a polydimethylsiloxane (PDMS) polymer and a silicon window are provided in Figure 3 (b, c). By scanning the wavelength of the idler photons, the absorption spectra is measured. The results show good agreement with the data obtained by a conventional IR spectrophotometer.

Figure 3. Interference pattern of signal photons. Black squares show the data without a sample; red squares show the data with a sample (a). The transmission spectra of a 143-μm-thick PDMS (b) and a 1-mm-thick silicon sample (c). Blue squares and pink lines show the results obtained by our method and by a commercial spectrophotometer, respectively (b, c). Figure 3a adapted from reference 4. Courtesy of the Institute of Materials Research.
IR optical coherence tomography
For OCT measurements, the experimental setup changes briefly, with the sample under study acting as the reflecting mirror Mi5. Interference patterns are observed at multiple positions of mirror Ms, which correspond to reflections from various interfaces in the sample depth. If the reflection coefficient at m-th boundary of the sample is given by:

then the visibility in Equation 1 is given by:

Thus from the measurements of the interference visibility at various displacements of the mirror, reflection strengths of sample interfaces can be inferred. A reference interference pattern is obtained when idler photons are reflected by the metallic mirror Mi (Figure 4a). The axial resolution of the method is 82 μm (twice the translation of the mirror), and the visibility is over 80%.
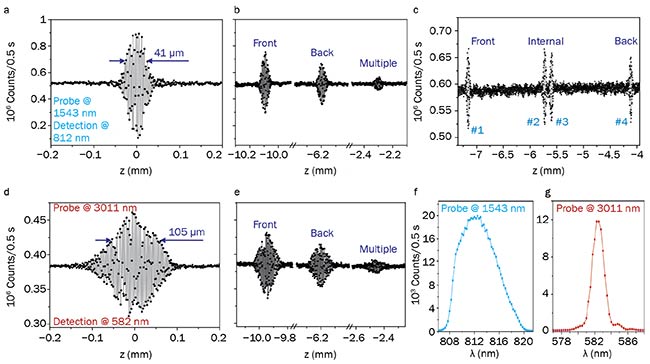
Figure 4. Interference fringes obtained when idler photons are reflected from a metallic mirror Mi (a, d), the silicon window (b, e), and the compound wave plate (c). Measurements are performed at λi = 1543 nm (λs = 812 nm detected) (a-c), and λi = 3011 nm (λs = 582 nm detected) (d, e). Spectra of detected photons (f, g). Figure 4a adapted from reference 5. Courtesy of the Institute of Materials Research.
When the silicon window is placed in front of the mirror, the interference peaks are observed at two different positions of the mirror, which correspond to reflections from the front and back surfaces of the sample. The third peak corresponds to multiple reflections between the front and back interfaces. Similar measurements were obtained at λi = 3011 nm (λs = 582 nm detected) (Figure 4d, e). A seamless tuning of the central wavelength is achieved by changing the crystal temperature and by choosing the poling period of the PPLN.
Figure 4c shows the results obtained for the compound zero-order wave plate, which consists of two quartz plates with a thin air gap in between. The interference fringes are observed at four different positions of the mirror Ms, which correspond to two external and two internal interfaces. These measurements enable us to determine the optical birefringence of the material6.
To show the imaging capability, the probing IR beam is focused on the sample and its position is scanned in the transverse plane. A metal-coated resolution test target covered by a silicon window is used, which is opaque for signal photons at 812 nm.
A measured reflectivity map of the sample is created (Figure 5). Spatial resolution is 50 µm and it can be further improved upon by using a focusing lens with a higher numerical aperture.

Figure 5. Test sample imaged at λi = 1543 nm (detection at λs = 812 nm). Shown are various areas of the sample (a, b). The image of the sample under visible light (c). Dashed squares show the imaged regions in (a) and (b). Visible-light image of the sample, covered by a silicon window (d). Adapted from reference 5. Courtesy of the Institute of Materials Research.
Discussion
The major benefit provided by the nonlinear interferometry is the ability to characterize sample properties in the IR range using easily available components built for the visible range. This is done without the requirement to know its optical properties in the visible range, which is a clear advantage over the method that uses copropagating photons7.
Absorption of the nonlinear crystal dictates the operation range. For example, LiNbO3 has a transmission range of 0.4 to 5 µm. Other crystals can extend the spectrum to mid- and far-IR, such as AgGaS2, which is transparent up to 15 µm.
The axial resolution of the OCT measurements depends on the spectral width of downconverted photons. The resolution can be further improved upon from the current value by at least one order of magnitude by using broadband SPDC produced in crystals with chirped poling. As an additional benefit, periodically poled nonlinear crystals dramatically enhance the SPDC efficiency and allow acquisition times of a few seconds with silicon photodetectors.
The presented approach allows characterization of sample properties in a broad range of IR frequencies by making use of efficient and available components built for visible light. Based on the obtained presented results, the method is not far from matching the performance of conventional techniques that rely on the direct generation and detection of IR light. Further research should focus on the
improvement of critical technical specifications, such as resolution, readout speed, and accuracy. These efforts will lead to the development of practical prototypes and subsequent commercial adoption of a new class of quantum-enabled metrology tools.
Meet the authors
Anna Paterova received her doctorate at Nanyang Technological University (Singapore) in 2019. Her research interests include quantum and nonlinear optics, infrared metrology, and optical instrumentation; email: [email protected].
Hongzhi Yang received his doctorate at the National University of Singapore in 2012. His research interests include nonlinear optics, precision measurement, and optical instrumentation; email: [email protected].
Leonid Krivitsky received his doctorate at Lomonosov Moscow State University in 2005. His research interests include quantum and nonlinear optics, quantum information processing, and quantum metrology; email: [email protected].
Acknowledgments
The authors would like to thank D. Kalashnikov and S. Kulik for their valuable contributions, and acknowledge the financial support of the Quantum Technology for Engineering program (QTE) and the National Research Foundation.
References
1. E.J. Heilweil (1989). Ultrashort-pulse multichannel infrared spectroscopy using broadband frequency conversion in LiIO3. Opt Lett, Vol. 14, pp. 551-553.
2. N.M. Israelsen et al. (2019). Real-time high-resolution mid-infrared optical coherence tomography. Light-Sci Appl 8, article 11.
3. X.Y. Zou et al. (1991). Induced coherence and indistinguishability in optical interference. Phys Rev Lett, Vol. 67, Issue 3,
pp. 318-321.
4. A.V. Paterova et al. (2018). Measurement of infrared optical constants with visible photons. New J Phys, Vol. 20, 043015.
5. A.V. Paterova et al. (2018). Tunable optical coherence tomography in the infrared range using visible photons. Quantum Sci Tech, Vol. 3, Issue 2, 025008.
6. A.V. Paterova et al. (2019). Polarization
effects in the nonlinear interference of down-converted photons, Opt Express,
Vol. 27, Issue 3, pp. 2589-2603.
7. D.A. Kalashnikov et al. (2016). Infrared spectroscopy with visible light. Nat Photonics, Vol. 10, pp. 98-101.