CCD-based instruments provide accurate photometric and colorimetric data for each image pixel, which enables precise characterization of displays, instrument panels, light sources and luminaires for parameters including color, luminance, uniformity, contrast, Mura and defects, and view angle performance.
Ron Rykowski and Hubert Kostal, Radiant Imaging, Inc.
The market for flat panel displays (FPDs) has undergone tremendous growth, driven mostly by increased demand for televisions, cell phones, computers, digital cameras and MP3 players. Similarly, applications for solid-state sources are expanding and include automotive lighting, surgical lamps, architectural luminaires, LED signs and a variety of consumer lighting products.
The need to support higher production quantities, together with escalating consumer demands for quality and competitive pressure, requires a metrology system that can provide manufacturers with high speed, accurate measurements of display and source luminance, color and defect characteristics.
In this article we look at the basic operating principles and performance tradeoffs of imaging colorimeters, a class of instruments that enable spatially resolved measurements of color and luminance that are directly applicable to FPDs and solid-state sources.
Measurement requirements
Developers of FPDs typically test qualities such as spatial uniformity, view angle performance, Mura (luminous variation defects), motion blur, color (chromaticity coordinates), brightness and contrast. In production environments, FPD testing is usually confined to brightness, color, Mura and defects. Brightness and color testing has traditionally been performed with spot colorimeters and spot radiometers. View angle performance is usually measured using either a conoscope or goniophotometer. With these instruments, the main drawback is that only a small portion of the display is sampled at once and it becomes necessary to perform multiple measurements sequentially (in order to sample a significant portion of the display surface), which results in long data acquisition times and the potential of being affected by temporal variations in the source.
The most common method of Mura and defect testing is human visual inspection. Needless to say, this approach is slow and becomes increasingly difficult to integrate into a production environment as the displays become physically larger. Furthermore, human inspection is subjective, and can vary through time or from operator to operator. This makes it difficult to enforce standards throughout the component vendor supply chain.
LED packagers, and those who integrate LEDs into illumination and display products, generally need to quantify luminous intensity distribution, dominant wavelength (color) and total luminous flux. Color and total flux can be measured using an integrating sphere coupled with a spectroradiometer. In the past, luminous intensity has been measured with a spot photometer or colorimeter mounted on a two-axis goniometer. Unfortunately, this approach is slow and only provides data along a few lines through the illumination pattern. A long measurement time can be an important consideration, even in research settings, because LED output is often not stable over time, especially in the presence of temperature or input power fluctuations. Thus, a long data acquisition period could result in spatial output variations that don’t really exist. Alternately, it may necessitate a warm up time as long as 30 minutes before measurements can begin. Again, this makes it difficult for manufacturers to accurately control quality.
More data for accurate decision making
The imaging photometer or colorimeter was developed to enable accurate, spatially resolved measurements of color and luminance. Obtaining data over the entire image of a device under test in a single measurement, rather than at a single point or along a line, avoids the limitations of the techniques described previously; it also permits implementation of more sophisticated image processing techniques, such as for Mura and defect detection.
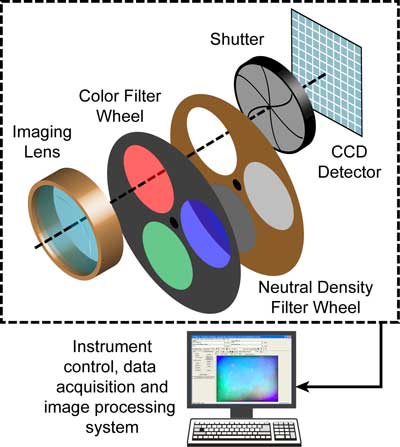
Figure 1. Main functional elements — lens, filters, shutter and CCD — of an imaging colorimeter.
The main components of an imaging colorimeter are an imaging lens, a set of color filters, a CCD detector and data acquisition and image processing hardware/software (Figure 1). Other elements may include neutral density filters and a mechanical shutter.
To perform colorimetric measurements, the system acquires an image of the device under test through each of the various color filters. When needed, neutral density filters are employed to ensure that each color measurement uses the full dynamic range of the sensor. Photometric measurements are performed using only the green (photopic) filter. Image data is then processed using previously determined calibrations to yield accurate color or luminance data for every pixel in the image. The spatial resolution of this data depends upon the imaging optics and sensor dimensions. Using this approach it is possible to measure the luminance and color of every pixel in a display simultaneously, at a given view angle. The instrument may also be mounted on a goniometer to automate these measurements for different view angles.
Because an imaging colorimeter acquires multiple data points in a single measurement, it is inherently much faster than an approach based on spot measurements. In addition, simultaneously measuring the entire surface of the device under test makes it useful for gauging color and luminance uniformity, and for identifying very small defects. The imaging colorimeter can even be used for assessing characteristics of projection systems such as distortion and focus quality. Likewise, the ability to render a processed image of the display can help to reveal subtle features (Mura) for qualitative analysis by a human operator.
CCD selection
In terms of hardware, the actual performance of an imaging colorimeter is highly dependent upon the specific type of CCD and color filters used. The majority of colorimeters are built using one of three different types of CCD; full frame, interline transfer and interline transfer with integrated color filters (Figure 2). A full-frame CCD is an unobstructed rectangular array of photodetectors. When light strikes the CCD, electronic charge is accumulated in each pixel. Readout occurs by sequentially shifting each row of pixels down into a readout register (not shown) until the entire array is cleared. Light must be physically prevented from reaching the CCD during the readout cycle by an external shutter to avoid image smearing.
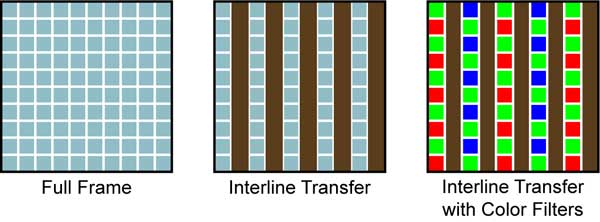
Figure 2. Commonly used CCD types in imaging colorimeters include full frame, interline transfer and interline transfer with integrated color filters.
In an interline transfer CCD, alternate columns are covered with an opaque layer. During readout, the accumulated charge in each exposed column is first transferred laterally to a nonimaging column; this charge is then shifted into the readout register in the same way as in the full frame CCD. The important difference is that another exposure can be accumulated while readout occurs and no external shutter is required to accomplish this.
The photodetectors in a CCD respond only to incident luminance and cannot measure color directly. Therefore, color measurement is accomplished by making separate exposures through red, green and blue color filters, and then combining the results in software. Alternately, another variant on the interline transfer architecture has each pixel overlaid with either a red, green or blue color filter for direct color measurement. In this case, the color value for a given pixel is determined by combining the results from several surrounding pixels.
Several CCD characteristics have a significant impact on the performance of an imaging colorimeter. One of these is dynamic range, which is defined as the maximum capacity of each pixel in electrons (called the full well capacity) divided by the RMS dark noise (the number of electrons read from the device with no input light). Full-well capacity scales with pixel size, and full frame CCDs typically have larger pixels, with full-well capacities in the 200,000 to 700,000 electrons range. This permits the sensor to deliver a dynamic range of 14 bits (16,384:1) or even 16 bits (65,536:1). In contrast, typical full-well capacity for an interline transfer CCD is in the 10,000 to 20,000 electrons range, which limits dynamic range to 12 bits (4096:1) or less.
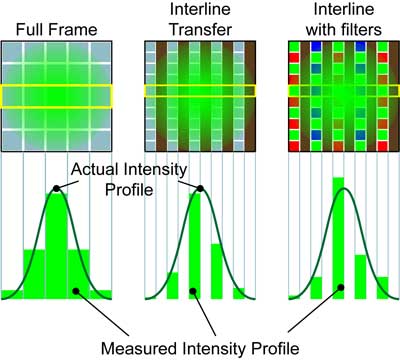
Figure 3. Low fill factor can cause important data to be lost, especially when imaging small sources or features.
Another important distinguishing feature is fill factor. Virtually the entire active area of a full-frame CCD is available for imaging, so nearly all image spatial information is captured. But, half of the surface of an interline transfer CCD is opaque, and any features that are imaged on these blocked areas are lost. In practice, interline transfer CCDs are often overlaid with a microlens array which redirects some of the light that would otherwise be blocked into active pixels. Microlens arrays can generally increase fill factor efficiency up to approximately 70 percent. However, this situation is aggravated by the presence of an integrated color filter pattern. Figure 3 shows how missing data can reduce accuracy when the output of a single LED is focused onto a small area on the CCD. This situation might occur when examining individual emitters in an LED sign.
Other practical differences between CCD types are that full-frame devices require an external shutter and often utilize active cooling (to minimize noise), while interline detectors are generally operated without cooling. Cooling and a shutter increase system size, weight, cost and complexity. In addition, an interline transfer CCD can be read out faster than a full-frame CCD, which could be a consideration in high speed production applications.
Calibrated color
For display applications, measuring color means determining how display output appears to the human eye. In order to correlate the color response of a CCD camera to the human visual system, measurements must be performed in a calibrated color space, such as one of those defined by the CIE. This necessitates matching the overall system response to the corresponding CIE color curves using color filters. Very close matching is possible by using specially designed glass filters external to full-frame or interline CCDs. Unfortunately, the RGB color filters typically integrated onto interline transfer CCDs do not provide a close match to the CIE curves. In this case, the instrument’s color accuracy depends strongly on the output spectrum of the illuminant and how the system is calibrated. For example, accuracy using poorly matched filters is typically substantially worse when measuring narrowband sources, such as LEDs. Figure 4 compares the transmission characteristics of a well-matched, custom filter and an integrated filter from an interline CCD with the CIE z curve.
Commercial product configurations
While, in theory, there are a number of possible hardware configurations for an imaging colorimeter, in practice, commercially available systems fall into three broad categories. Each of these is optimized for a certain range of tasks.
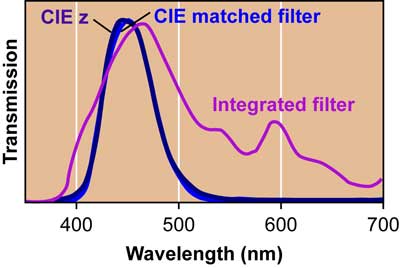
Figure 4. Individual color filters that closely match the system response to the CIE curves can be obtained, but the filters typically integrated directly onto CCDs do not provide a good match. This graph shows the CIE z curve together with the system response using a well-matched filter vs. an integrated filter.
The first configuration utilizes an interline transfer CCD with on-chip filters. This approach yields low cost and high speed, but with limited dynamic range (usually 8 to 10 bits) and color accuracy. This makes these a good choice for many on-line or at-line production inspection tasks. However, their limited fill factor means they are not optimum for examining small-scale features, such as pixel and subpixel defects.
Alternatively, interline transfer CCDs can be used with external, CIE matched filters. This offers a good compromise between cost and performance. With a typical dynamic range of 12 bits and excellent color accuracy, they deliver enough performance for production testing of FPDs, backlights, projection systems, instrument panels and LED backlights.
The final configuration mates a full-frame CCD with external, CIE matched color filters. This combination delivers superior dynamic range (up to 16 bit), signal-to-noise ratio and color accuracy. It is typically more expensive and has slower readout speed than the interline CCD-based colorimeters. These attributes make it well-suited to demanding, high contrast applications such as automotive headlamp evaluation, high end projector contrast testing, instrument panel measurements, LED screen calibration and R&D applications.
System software
Hardware and software for calibration, instrument control and data analysis is the other major component of an imaging colorimeter (Figure 5). Since the accuracy of any imaging colorimeter is only as good as its calibration, the ease with which the user can perform periodic recalibration is a significant factor in long term instrument performance and utility. Typical required calibrations include luminance uniformity, luminance scaling and color. In particular, the capability for performing on-site color calibrations when measuring specific spectra can increase color accuracy of the system. All of these will be supported in a full-featured software package.
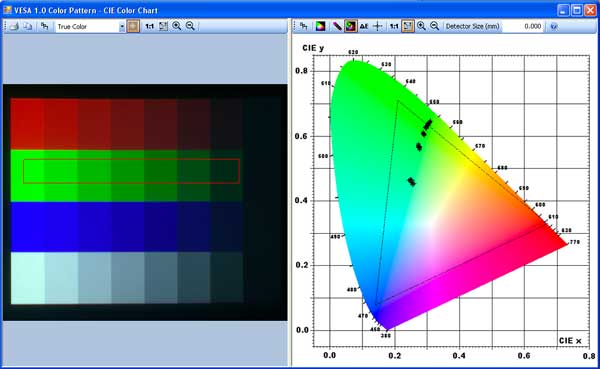
Figure 5. System software should enable calibration, instrument control and provide a variety of tools for data analysis.
Ideally, system software should provide a range of data analysis tools, such as 2-D and 3-D plots of luminance, color coordinates, correlated color temperature (CCT), tristimulus values and color/luminance difference. It’s also helpful when the vendor provides standard software interfaces to access all these functions, such as through the use of .NET or ActiveX controls. This enables the user to create customized interface for a specific application without having to code from scratch, or to have such interfaces cost-effectively added by the colorimeter vendor. It’s also helpful when the vendor’s software interface is common among all their products, so that investments in custom coding and operator training are preserved as hardware needs evolve.
In conclusion, imaging colorimetry enables display and light source manufacturers to make spatially resolved measurements of color and luminance that are difficult to accomplish by other means. However, it’s important for the user to understand the capabilities and performance tradeoffs of various instrument configurations in order to choose the right imaging colorimeter for a specific application.