Over the past two decades, the utility of IR microscopy for the chemical identification of small particles has led to its widespread use. By combining imaging detectors with IR microscopes, applications have expanded to include forensics, pharmaceutical manufacturing and cancer research.
William J. McCarthy, Thermo Electron Corp.
Fourier transform infrared (FTIR) spectroscopic techniques are valued for their rapid, nondestructive analysis of materials as well as for their ability to identify the chemical signature of small samples. The Michelson interferometer is the foundation of the modern FTIR spectrometer, comprising a beamsplitter that separates and combines two optical beams. One travels a fixed reference path, while the other travels via a moving mirror. The beams then recombine to create an interferogram, which is transformed and processed into a spectrum of infrared frequencies corresponding to the chemical structure of the sample.
The interferometer is the reason FTIR is so fast and sensitive, enabling the detector to pick up the full IR response. A filter or dispersive element would limit the amount of radiation reaching the detector. The speed of the moving mirror enables the collection of an entire scan of a spectrum in less than a second. Multiple scans can be averaged to improve the signal-to-noise ratio and to provide speedy analysis. An internal laser calibrates the IR frequencies to provide highly accurate and reproducible spectra. These advantages enable the application of sophisticated mathematical methods such as database searching and chemometrics.
Recent advances in FTIR technology have led to the rise of chemical imaging as a spectroscopic technique. Chemical imaging employs fast, specialized detectors and positioning stages to augment the information-rich spectral content with high-fidelity spatially resolved images of compositional structure.
The importance of this technique is increasing as the chemical specificity of FTIR is applied to samples wherein the spatial distribution of the chemical composition is essential to their function. Examples include biomedical applications that detect chemical changes in biological tissues that have a complex spatial structure. Recent studies have examined cross sections of skin for chemical changes caused by the application of cosmetics or drugs. Other studies have examined metastatic cancer in lymph nodes, chemical changes in bone tissue caused by arthritis, and the degeneration of cartilage.
Infrared and imaging
In general terms, an image is an optically formed representation of an object, such as a digital file produced by a CCD or a digital camera. Digital imaging reproduces the spatial information from a region of interest and images it onto a two-dimensional optical detector. The relative intensity of the visible spectrum is stored in each pixel of the detector.
Chemical imaging uses IR optics to form a representative reproduction of the chemical composition of a sample. In this case, each pixel represents the spectrum of the sample area that it measures. Because an average-size spectrum can have as many as 1000 frequency points, a chemical image consists of a huge amount of information.
Managing, visualizing and analyzing this data requires a sophisticated and interactive software package.
In an experiment, thin sections of prepared human tissue were placed on a reflective, low-e glass slide for IR analysis (Figure 1). (Low-e glass is coated to reflect IR radiation and to transmit visible light.) The spectrum corresponding to the visual image of the sample identified.
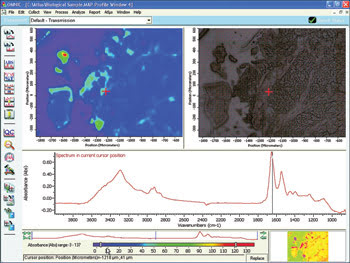
Figure 1. Managing, visualizing and analyzing the data generated in Fourier transform infrared chemical imaging requires a sophisticated and interactive software package. The imaged tissue was prepared on a low-e glass microscope slide.
A movable bar in the spectrum window selects the frequency. To the left is a false-color display of the absorbance intensities at a particular IR frequency. The blue, or cool, colors show low absorbance values, and the red, or hot, colors are high absorbance values. The amount of a material present is linearly proportional to absorbance, so a low absorbance indicates low levels of protein. The color bar below the spectrum shows the range of absorbance values for that frequency.
Any FTIR microscope analysis is a trade-off among speed, signal-to-noise ratio and spatial resolution. The sample in Figure 1 used four scans per pixel to cover a 13-mm-sq area in about 2.5 minutes. Signal-to-noise can be improved by increasing the number of scans that are averaged, but at a cost of speed. For chemical imaging, this can be significant. With all other parameters being equal, collecting for four times as long doubles the signal-to-noise ratio.
Best aperture scheme
Single-element maps have the same trading rules but are more flexible because an aperture system is used to restrict or mask the sampling area to the region of interest. The best aperture scheme uses a confocal or dual-aperture approach to remove the effect of IR diffraction from the sample.
Apertures can be adjusted to a larger area to improve signal, or small apertures can be overlapped to provide the ultimate achievable spatial resolution, albeit with a significant increase in analysis time. Also, if a large area of a sample needs to be covered, a single-element detector does not have to cover every single point but can sample a few points to give a statistically valid assessment of spatial distribution.
Because of these trade-offs, most chemical imaging systems offer the ability to use both an array detector and a single-element detector. The Nicolet Continuum XL microscope from Thermo Electron Corp. of Madison, Wis., uses a dual-aperture scheme. It features a 28-element photoconductive linear array, the choice of IR objectives with two magnifications and the choice of five types of single-element detectors. The microscope enables the user to rapidly scan a large area using the array, to review the resulting map, to go to regions of interest collected in imaging mode, and then to switch to single-point to enhance that region.
Analysis and visualization
Regardless of how the chemical image is generated, a visualization and analysis software package is necessary to get the desired answers from the massive amount of information. The software must be designed to address the spectroscopic requirements as well as to relate the visual information. For example, the objective of FTIR chemical imaging is to detect the specific chemical contrast that highlights compositional difference within a sample. Chemical imaging data thus should be presented as multiple spectra arranged spatially or as a series of spatially resolved images produced at a very narrow range of wavelengths.
The simplest visualization software allows a user to view the data in both modes. The images are produced in false color in both a flat and a three-dimensional perspective. More advanced techniques (known as peak-picking) sum multiple-wavelength regions to improve signal-to-noise and provide baseline correction and processing of derivatives to remove image artifacts and to improve chemical contrast.
Multivariate chemometric techniques such as principal component analysis reveal the contribution and distribution of materials by reducing the 1000 individual wavelength images into several important ones. For example, an image of a section of brain tissue consisting of 1000 frequency plots was reduced to two principal components (Figure 2). The first principal component analysis showed differences in tissue density. The second highlighted a small section that further investigation determined was a damaged blood vessel.
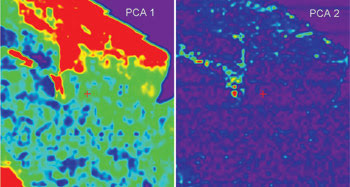
Figure 2. An image of brain tissue formed from 1000 frequency plots was reduced to show two principal components, revealing differences in tissue density (left) and a damaged blood vessel.
The Food and Drug Administration has released a series of guidelines as part of an initiative to encourage the development of analytical tools to improve pharmaceutical manufacturing. Part of this initiative is to better understand processes in the supply chain so that they may be improved, and chemical imaging will play an important part in this.
Future trends and applications
Pharmaceutical methods use FTIR because of its chemical specificity and high-content information, as well as its simple sample preparation and nondestructive analysis. Other areas where chemical imaging can assist the pharmaceutical industry are in studying sample homogeneity, content uniformity, analyzing the blending and drying process, and studying degradation products.
A trend that is just beginning is that chemical imaging is being introduced into application areas where the analyst is not a spectroscopist. One example is in medical applications, where researchers may be unable to interpret a spectrum but are familiar and comfortable using images as a diagnostic tool. Future advances in chemical imaging software will recognize this need for easy-to-use imaging tools.
Meet the author
William J. McCarthy is product manager of FTIR Microscopes and Imaging at Thermo Electron Corp. in Madison, Wis.; e-mail: [email protected].