Researchers at the National University of Singapore developed a confocal laser speckle autocorrelation method to image dynamic flow in microvasculature. The technique is label-free and enables real-time and quantitative imaging of blood flow on the microscopic level.
The system shares many characteristics of a confocal fluorescence microscope; like the confocal fluorescence microscope, it is able to obtain high-quality, detailed flow images from thick tissue samples. The method described by the researchers does not require fluorescence labeling or any other sample preparation procedure. Instead, the contrast mechanism is intrinsic, based on optical phase changes caused by flowing blood cells, which can be converted into random light intensity fluctuations.
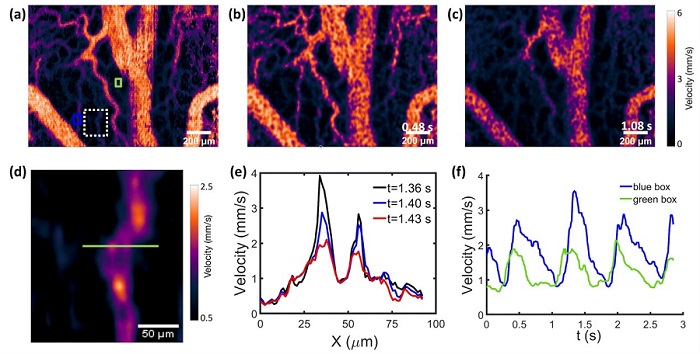
Blood flow velocity images obtained from a chicken embryo using LS-LSAI. (a) An averaged blood flow velocity map over the entire image stack. (b) An instantaneous blood flow image at the time point 0.48 s, when the flow velocity reached the maximum. (c) An instantaneous blood flow image at the time point 1.08 s, when the flow velocity reached the minimum. (d) A magnified view of the white dashed boxed region in (a). (e) Cross-sectional flow velocity profiles taken along the green line in (d) at various time points. (f) The time courses of spatially averaged blood flow over the regions indicated by the blue and green squares in (a). Courtesy of Opto-Electronic Advances.
When a tissue sample is illuminated with a laser beam, the acquired images generally contain random intensity fluctuations, the so-called laser speckles. The confocal laser speckle imaging setup is implemented on top of a line-scan confocal microscope, which forms an illumination line on the sample. A line camera is positioned to selectively capture the speckle signals coming from the illuminated line and effectively reject the out-of-focus light, which is a serious problem leading to reduced contrast and resolution in conventional laser speckle imaging techniques.
By quickly scanning the illumination line across the sample surface, two-dimensional raw speckle images can be acquired at more than 200 fps. Time series analysis of the speckle images is performed pixel by pixel — a strategy that preserves the spatial resolution in the processed images.
Autocorrelation and speckle contrast calculation are both commonly used modes of analysis that link the speckle-derived parameters to the local blood flow velocity.
However, the combination of confocal microscopy with auto correlation-based speckle analysis, called line scan laser speckle autocorrelation imaging (LSAI), bears significant advantages. Small-animal imaging experiments enabled the researchers to demonstrate that LSAI is able to quantify the local flow velocity at individual pixels, which are significantly smaller than the typical diameter of capillaries. Moreover, LSAI is fast enough to capture video-rate flow velocity changes at the same microscopic level.
An immediate and important application of confocal laser speckling imaging is to map and quantify dynamic blood flow in microvessels, which are the smallest blood vessels within organ tissues, including terminal arterioles, metarterioles, capillaries, and venules. Analyzing the circulation of blood in the microvasculature, or microcirculation, is fundamental in the analysis and understanding of the pathophysiology and pathogenesis of a wide range of human diseases.
Experimental tools with adequately high temporal resolution and spatial resolution are highly desirable for in vivo visualization and, more importantly, quantitative measurement of the time-dependent blood flow maps in the microvasculature for further clinical and preclinical investigations.
The researchers believe that the device could become a standard imaging tool in microcirculation research, as well as for clinical diagnosis.
The research was published in Opto-Electronic Advances (www.doi.org/10.29026/oea.2022.210045).