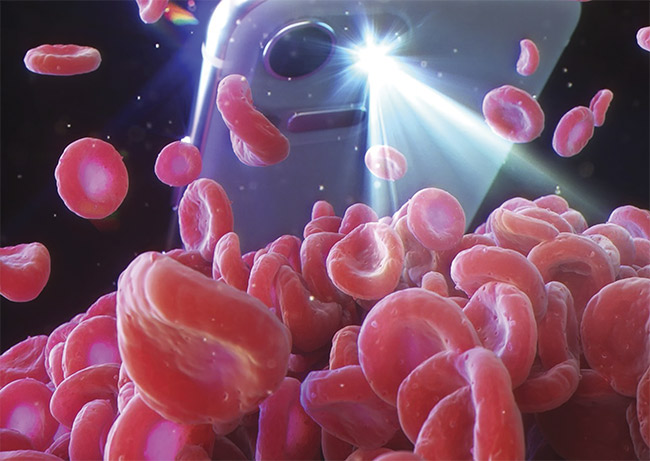
Spectral superresolution imaging of the inner eyelid acquired by a smartphone camera can be used to test for blood hemoglobin levels at the point of care, rather than in a hospital setting.
SANG MOK PARK AND YOUNG KIM, PURDUE UNIVERSITY
As one of the most routinely performed laboratory tests, a blood hemoglobin test is used to measure levels of the oxygen-carrying protein in the blood. Potentially reduced levels are commonly associated with certain conditions. Clinics order the tests to diagnose and detect anemia, hemorrhages, and hematologic disorders, and as a basis to initiate transfusions, among other reasons. However, a downside of conventional hemoglobin testing is that it requires a blood draw from a patient who, due to these diseases and disorders, already has a reduced hemoglobin level.
Blood hemoglobin levels can be
estimated noninvasively using a
smartphone camera. Courtesy
of Sang Mok Park and Young Kim.
Noninvasive technologies
To overcome this drawback, several technologies are currently being developed to noninvasively measure blood hemoglobin levels and anemia. Noninvasive devices such as Masimo and OrSense are currently commercially available. Even though these devices allow real-time and continuous monitoring of blood hemoglobin levels based on advanced processing of optical signals, specialized equipment with a relatively high cost is still required in a hospital setting, due to the large units that are required to run the sensors.
As the ownership of smartphones has dramatically increased, mobile health (mHealth) technologies — those that use smartphones and mobile apps to monitor various conditions — have received considerable attention. In this context, noninvasive blood hemoglobin measurements and anemia assessments using mobile devices have progressed. It should be noted that when the accuracy and precision of measurements are limited, anemia screening — which categorizes low, moderate, or normal levels of the protein — often serves as a warning that problems may develop at these levels.
One diagnostic technology, called HemaApp, uses the built-in camera of a smartphone to estimate anemia status1. This mobile app analyzes blood pulse signals from a series of RGB images of the fingertip, using feature extraction methods. Smartphone RGB images of fingernails also enable anemia assessments2. With a fingernail-based mobile app, the blood hemoglobin prediction algorithm is built using skin color data from images, along with image metadata (imbedded information about when and where an image was created). Noninvasive, repeated measurements of hemoglobin levels can be possible by calibrating the device to an individual’s diagnostics.
Imaging of the inner eyelid (the palpebral conjunctiva) via a smartphone has also been used for noninvasively assessing clinical signs related to anemia3. Quantitative parameters, such as the erythematous index and color information extracted from RGB images, allow classification of anemia status.
Importantly, diverse photonics-based methodologies have also been tested for noninvasive blood hemoglobin quantification and anemia detection4. In the visible and near-infrared (NIR) wavelength range, blood hemoglobin concentration affects optical path length, pulsatile modulation, and scattering properties in biological tissue. The unique spectral signatures of various hemoglobin variants and other chromophores can be modeled for predicting blood hemoglobin content for anemia assessments.
Reflectance spectroscopy and light-scattering methods that allow for analyzing microvessels and hemoglobin content in tissue have become popular research areas in the field of biomedical and tissue optics. A handful of researchers have used visible light and NIR reflectance spectrometers to analyze the optical properties of the inner eyelid, which provides a noninvasive method to monitor anemia status.
Even though these spectroscopic analyses have shown reliable and consistent performance, there is a major limitation to their use for mHealth point-of-care diagnostic testing. Such spectroscopy technologies often require bulky optical components — along with additional accessories, such as a spectrometer and tunable filters — which hampers successful clinical translations for mHealth5.
Spectroscopy for mobile health
Researchers at Purdue University recently introduced a data-driven, less hardware-dependent method to incorporate optical reflectance spectroscopy into mHealth technology6. The technique allows for noninvasively quantifying blood hemoglobin content from the inner eyelid, using an unmodified smartphone (Figure 1). As a sensing site, the inner eyelid is used not only because of its accessibility, but also due to its relatively uniform microvasculature and the absence of melanocytes (pigment-producing cells) in the skin.
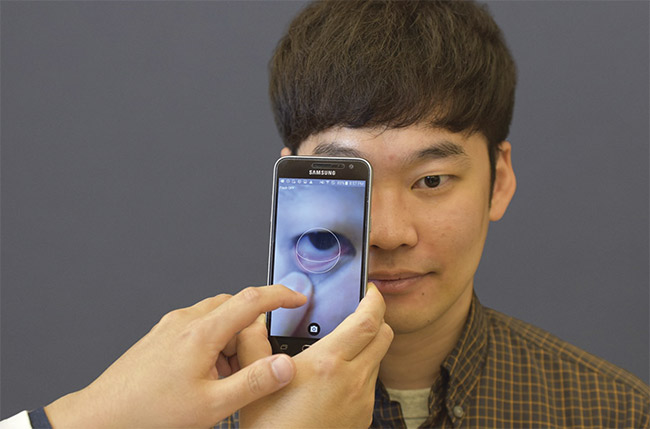
Figure 1. The mobile health (mHealth) application for noninvasive blood hemoglobin quantification. The easily accessible inner eyelid (palpebral conjunctiva) is used as a sensing site. Courtesy of Sang Mok Park and Young Kim.
The technology is based on spectral superresolution (SSR), which virtually transforms a built-in smartphone camera into an imaging device for spectroscopic quantification of blood hemoglobin content. SSR enables mathematical reconstruction of high-resolution reflectance spectra from the three color values of the RGB channels acquired by the camera (Figure 2a). Superresolution is defined as a high-resolution reconstruction of the digital signals acquired by low-resolution systems. This concept was extended to the frequency domain for purposes of the Purdue study.
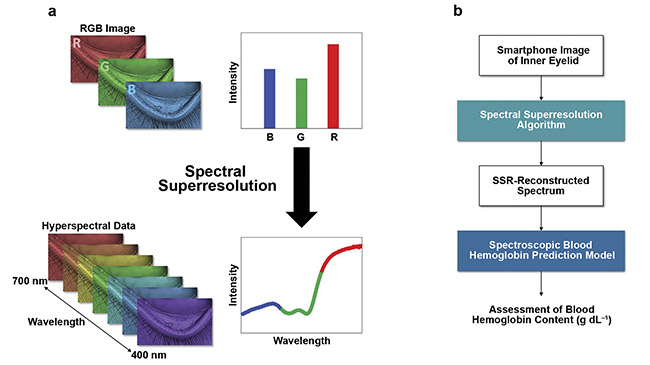
Figure 2. Statistical learning framework blood hemoglobin analysis using an mHealth algorithm. The concept of spectral superresolution (SSR)
spectroscopy (a). The incorporation of the SSR algorithm and the blood hemoglobin prediction model for accurately and precisely quantifying blood
hemoglobin content (b). Courtesy of Sang Mok Park and Young Kim.
First, to stably reconstruct high-
resolution spectra from RGB images, the researchers established a statistical learning framework of SSR trained by a relatively small data set, also acquired by a low-end smartphone camera. Second, to compute hemoglobin content in the blood, a prediction model was built using reconstructed spectra reflected from the inner eyelid (Figure 2b). While analytical model-based computation methods could be used, the researchers simplified the modeling by using partial least squares regression (a linear projection of variables) to capture the most significant variations for blood hemoglobin.
Given the high prevalence of anemia in sub-Saharan Africa, the authors conducted a clinical study in Kenya, working with the Academic Model Providing Access to Healthcare (AMPATH) program. AMPATH is a partnership between academic health institutions in high-income countries and health centers and universities in low-income countries. Moi University Teaching and Referral Hospital in Eldoret, Kenya, provided the clinical setting for the research team.
In this study, which included testing 153 participants (Figure 3) from the hospital, the basis for useful results involved using a commercial hematology analyzer, immediately before or after imaging of the inner eyelid, to measure blood hemoglobin levels of venous blood draws.
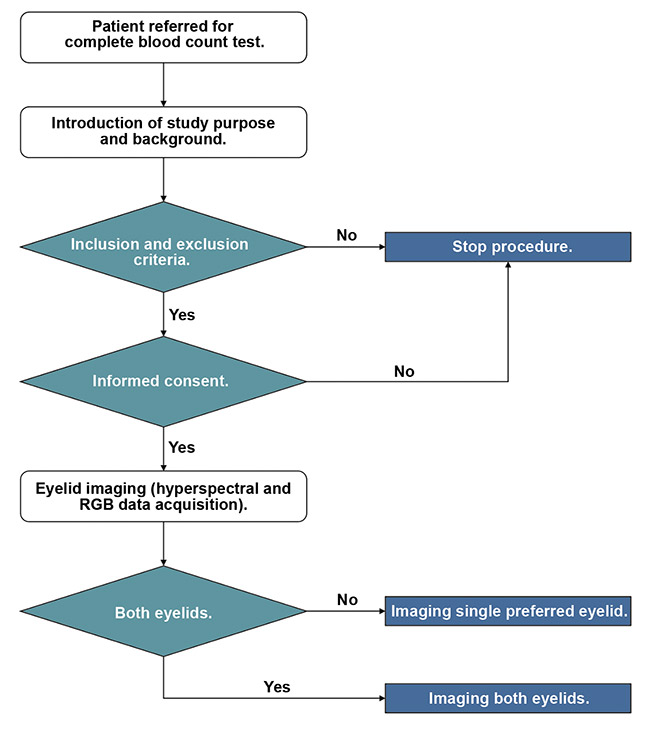
Figure 3. The overall study procedures used during the clinical study at Moi University Teaching and Referral Hospital in Eldoret, Kenya. Courtesy of Sang Mok Park and Young Kim.
The clinical laboratory hemoglobin values covered a wide range, from 3.3 to 19.2 g/dL. Although the sample size was relatively small, the reliability of the mHealth blood hemoglobin prediction algorithm was ensured by employing separate training (90%) and validation data sets (10%). A group of 138 randomly selected individuals was used as a training data set to establish the parameters by which the other data was measured.
Performance of mHealth app
In the visible wavelength range, the reconstructed spectra aligned well with the original data that was measured by a spectroscopic imaging system. More importantly, the reconstructed spectra show the consistent performance in a broad range of clinical laboratory hemoglobin levels, reflecting varying levels of anemia (Figure 4).
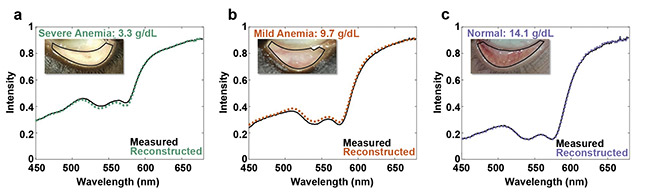
Figure 4. Representative SSR hyperspectral reconstruction for severe anemia with 3.3 g/dL (a), mild anemia with 9.7 g/dL (b), and normal condition with
14.1 g/dL (c). Courtesy of Sang Mok Park and Young Kim.
Using the RGB data acquired by the mobile app, the computed blood hemoglobin levels of the validation data set show a high coefficient of determination R2 value of 0.912 and a narrow 95% limits of agreement of −2.20, 2.29 g/dL with a bias of 0.04 g/dL in the Bland-Altman plot (Figure 5), which analyzes agreement between two assays. These results suggest that the mHealth blood hemoglobin prediction algorithm could offer reliable assessments.
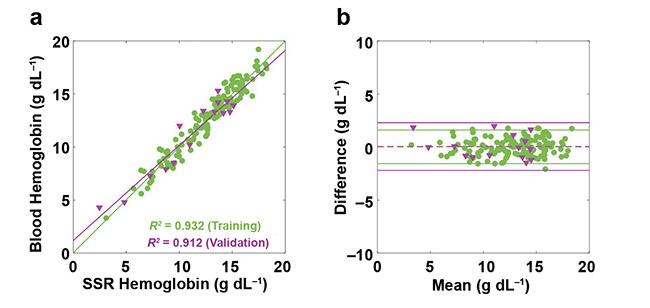
Figure 5. Performance of SSR hemoglobin assessments using the mHealth algorithm. Correlations
between clinical lab blood hemoglobin levels and computed levels of the training (138 individuals)
and validation (15 individuals) data sets (a). Bland-Altman analyses between measured and computed levels (b). Courtesy of Sang Mok Park and Young Kim.
Using the same validation data set, the researchers further analyzed receiver operating characteristic (ROC) curves to evaluate the use of the proposed SSR blood hemoglobin assessments as anemia assessments. When the blood hemoglobin thresholds from the World Health Organization guidelines are used to define anemia, the performance of anemia assessments with areas under the ROC curves are greater than 0.98 for both males and females. These results suggest that the mHealth technology also has the potential for noninvasive anemia assessments as one of the possible clinical applications.
Reduced need for hardware
The mHealth spectroscopy technique for noninvasively measuring levels of blood hemoglobin can serve as an example showing that a data-science approach can minimize the need for complex hardware components, which is a common challenge in point-of-care testing. Another advantage is that the computational framework of SSR can easily be extended to various smartphone models after incorporating the smartphone camera’s sensitivity function, which varies from model to model.
Based on this initial result, the Purdue team received first prize in the National Institutes of Health Accelerator Challenge to further scale their research up for noninvasive, real-time, and continuous blood hemoglobin monitoring without blood sampling. This mHealth technology could be useful in both emergency medicine and resource-limited settings, and it could be particularly valuable to frontline health care workers.
Meet the authors
Sang Mok Park is a doctoral student in the Weldon School of Biomedical Engineering at Purdue University. His research focuses on developing data-driven mobile spectroscopy technologies for point-of-care diagnostics; email: [email protected].
Young Kim, Ph.D., is an associate professor in the Weldon School of Biomedical Engineering at Purdue University. His research focuses on data-centric approaches and the fusion of physical and digital properties to minimize hardware complexity and facilitate mHealth research and the translation of mobile technologies into the clinic; email: [email protected].
References
1. E.J. Wang et al. (2017). Noninvasive hemoglobin measurement using unmodified smartphone camera and white flash. 39th Annual International Conference of the IEEE Engineering in Medicine and Biology Society, pp. 2333-2336.
2. R.G. Mannino et al. (2018). Smartphone app for non-invasive detection of anemia using only patient-sourced photos. Nat Commun, Vol. 9, Issue 1, pp. 1-10.
3. G. Dimauro et al. (2019). Detecting clinical signs of anemia from digital images of the palpebral conjunctiva. IEEE Access, Vol. 7, pp. 113488-113498.
4. J. McMurdy et al. (2009). Photonics-based in vivo total hemoglobin monitoring and clinical relevance. J Biophotonics, Vol. 2, Issue 5, pp. 277-287.
5. T. Kim et al. (2016). Toward laboratory blood test-comparable photometric assessments for anemia in veterinary hematology. J Biomed Opt, Vol. 21, Issue 10, p. 107001.
6. S.M. Park et al. (2020). mHealth spectroscopy of blood hemoglobin with spectral super-resolution. Optica, Vol. 7, Issue 6,
pp. 563-573.