Combined with atomic force microscopy, the technique is effective in determining the chemical properties of biopolymers, polymer blends and 2D materials.
MAXIMILIAN BREUER AND MATTHIAS HANDLOSER, TOPTICA PHOTONICS AG, AND TOBIAS GOKUS, NEASPEC GMBH
Fourier transform infrared spectroscopy (FTIR) from about 2 to 20 µm is a common analytical tool for characterizing material and useful in a range of applications in analytical chemistry, biology, geology and medicine.
Besides chemical analysis, conventional FTIR spectroscopy can determine crystallinity, molecular orientation, stress and strain, as well as free-carrier concentration in a range of material classes. Due to the ubiquitous diffraction limit, the spatial resolution of FTIR spectroscopy is limited to about half the wavelength of the incident IR excitation light — about 5 to 10 µm — thus inhibiting the assessment of local material properties on the nanoscale.
While conventional FTIR spectroscopy has limited spatial resolution, a recently developed technique called nano-FTIR achieves nanoscale-level spatial resolution by combining IR spectroscopy and scattering-type near-field scanning microscopy (s-SNOM). It can identify material properties at a 10-nm length scale. Near-field probes are raster-scanned across the sample surface while being illuminated by a broadband mid-IR laser. To cover most relevant material resonances in the mid-IR, the broadband laser’s emission is tuned continuously between 5 and 15 µm. The spectral width of each of the spectra (>400 cm-1) yields reliable, material-
specific spectroscopic signatures and significantly reduces measurement time — both vital to establish nano-FTIR as a standard analytical tool for complex functional nanostructures. The technique is particularly well-suited for assessing basic polymer structures. Noninvasive and highly sensitive, it can determine the chemical composition of polymers, biopolymers, polymer blends and bio-
minerals based on characteristic molecular vibrational absorption bands.
Nanoscale hot spot
Nano-FTIR employs a sharp, metal-coated atomic force microscope (AFM) probing tip, as is the case with other tip-enhanced, near-field optical microscopy techniques such as tip-enhanced Raman scattering (TERS) and tip-enhanced photoluminescence (TEPL). The probe is illuminated by an external IR laser to create a nanoscale hot spot at the tip apex (Figure 1). The AFM tip acts as an antenna, converting the incident mid-IR laser light with its electric field into an enhanced and confined electromagnetic field at the apex of the tip, forming a nanofocus1. This nanofocus interacts with the sample material below the tip and generates a near-field interaction whose strength is determined by the local dielectric properties of the sample material. The AFM probing tip scatters the optical near fields into the far-field zone. The elastically tip-scattered light is then detected interferometrically and analyzed, yielding simultaneously the amplitude and phase of backscattered light.
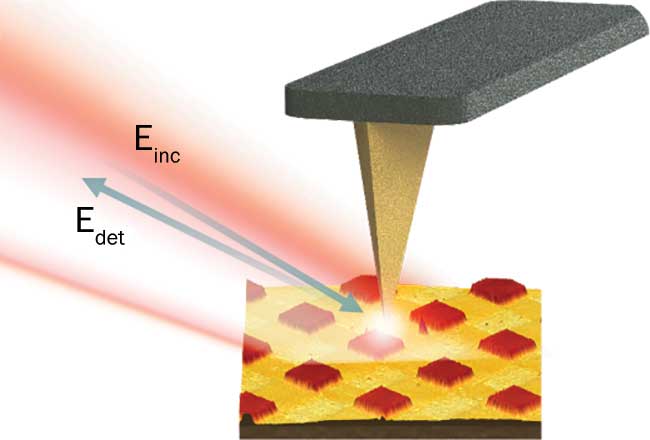
Figure 1. Working principle of scattering-type near-field scanning microscopy. An external IR laser beam is focused on a metallic AFM probing tip. Acting as an antenna, the AFM tip converts the incident focused light into an enhanced and highly confined light field at the apex of the AFM tip, thus creating an infrared nanofocus. The nanofocus interacts locally with the sample material, generating a near-field interaction. The AFM probing tip scatters these near fields into the far-field zone (Edet). The tip-scattered light is then detected and analyzed with a Fourier-transform spectrometer based on an asymmetric Michelson interferometer. Courtesy of Neaspec GmbH.
As the s-SNOM signal originates from light scattered at an AFM tip with a diameter of only 20 to 30 nm, light sources with high spectral irradiance and intensity, pointing stability, and good mode profile for stable tip-focusing are required to achieve sufficient data quality. This results in a good signal-to-noise ratio and, consequently, fast measurement speeds. As previously demonstrated, for mid-IR near-field imaging measurements, line-tunable continuous-wave laser sources such as quantum cascade lasers (QCLs) or CO2 gas lasers fulfill such requirements. For nano-FTIR, however, suitable commercially available, tabletop mid-IR broadband laser sources that fulfill these requirements were not available until recently.
Difference frequency generation
Due to a lack of suitable light sources, a novel laser system based on an Er-doped fiber laser system that emits tunable pulse trains covering the wavelength range of 5 to 15 µm (for example, 20 to 60 THz or 670 to 2000 cm-1) with excellent beam characteristics was developed. This is realized by employing a difference frequency generation (DFG) scheme in a nonlinear optical crystal. The collimated output allows for diffraction-limited focus size on the sample and the near-field probe. In addition, the output power is stable for extended periods, which enables the extraction of quantitative data even during lengthy measurement intervals. The simultaneous excitation of a wide range of states is possible due to the unique >400 cm-1 broad emission spectra (Figure 2).
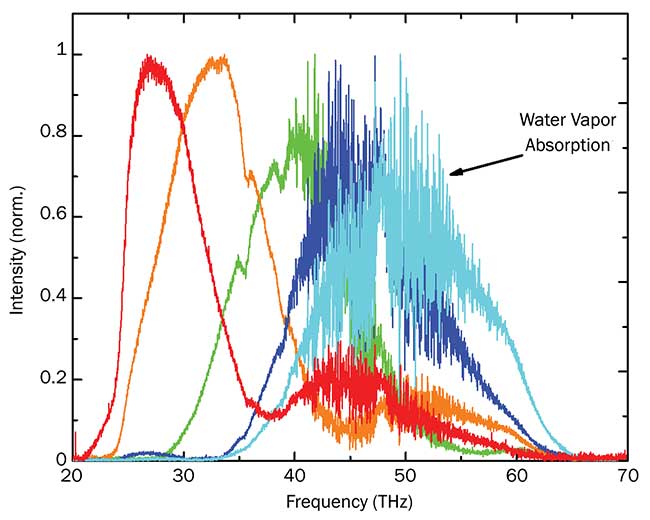
Figure 2. FTIR spectrometer measurements showing exemplary output spectra of the FemtoFiber dichro midIR fiber laser and the water vapor absorption lines around 50 THz. The laser is continuously tunable from 5 to 15 µm with a spectral width of 400 cm-1. Courtesy of Toptica Photonics AG.
This laser system allows also for sophisticated excitation schemes, making use of the intrinsic advantage of fiber laser to be easily synchronized by sharing a single oscillator. For these pump-probe excitation schemes, the mid-IR laser serves as master seed oscillator, capable of scanning a range up to 500 ps with respect to the pump laser. This multibranch system consists of phase-locked pulses being intrinsically synchronized down to the attosecond level. Due to the employed DFG concept of the mid-IR laser, the emitted laser power is extraordinarily stable. The exemplary calculated shot noise limit for the 50 THz spectrum is −112 dBc/Hz being reached by the system (Figure 3).
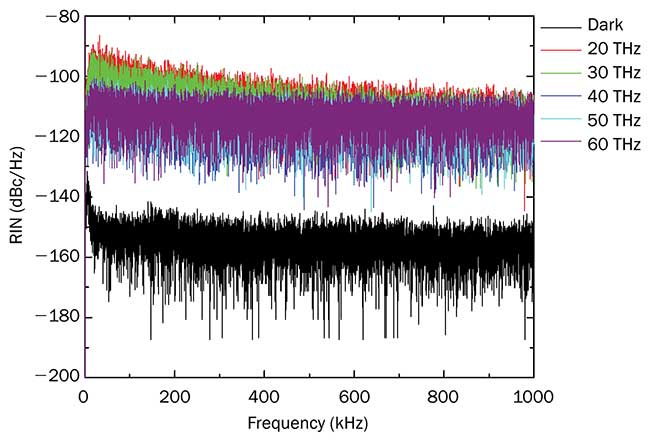
Figure 3. Measured output relative intensity noise (RIN) of the FemtoFiber dichro midIR. Calculations show that the noise is at the shot noise limit for all frequency bands. Courtesy of Toptica Photonics AG.
Nano-FTIR spectroscopy extends the concept of s-SNOM by allowing, for the first time, the acquisition of local near-field absorption and reflection spectra in the mid-IR fingerprint spectral range between about 670 to 2100 cm-1 (2,3). For nano-FTIR spectroscopy, the output of the mid-IR broadband laser is coupled to a built-in Michelson interferometer of the neaSNOM (Figure 4b)5 s-SNOM microscope (Figure 4a).
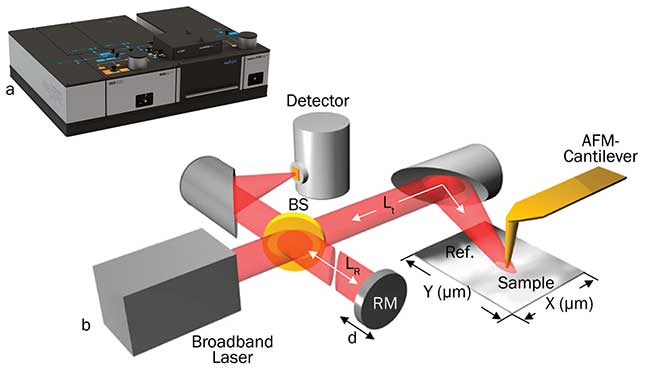
Figure 4. neaSNOM near-field optical microscope system configured for nano-FTIR spectroscopy (a). Schematic diagram depicting the optical components of the neaSNOM nano-FTIR system (b). A broadband mid-infrared laser source (Toptica FemtoFiber dichro midIR) is coupled to the asymmetric Michelson interferometer of the neaSNOM consisting of a beam splitter (BS), a reference mirror (RM) and a sensitive mid-IR detector. Courtesy of Neaspec GmbH.
Analogous to classical FTIR spectroscopy, nano-FTIR spectra are obtained by recording an interferogram of the tip-scattered light as a function of the reference mirror position of the interferometer, and subsequent Fourier transformation yields nanoscale-resolved IR spectra. Due to the asymmetric interferometer configuration, both a near-field amplitude and phase spectrum of the backscattered light are recorded simultaneously. The information about the wavelength-dependent local dielectric function of the sample material are encoded in those amplitude and phase spectra. For weakly scattering materials such as polymers, the near-field amplitude and phase are directly related to the macroscopic absorption and reflection coefficients, respectively3. Representative nano-FTIR reflection and absorption spectra (red curves) measured on a bulk (5 × 5 × 5 mm) polycarbonate sample are shown in Figure 5. To make full use of the tunable output of the fiber mid-IR laser and achieve maximum spectral coverage between 670 and 2100 cm-1 for the nano-FTIR measurements, only two DFG output spectra centered at about 1000 and 1600 cm-1 are measured and combined by data post-processing.
Absorption spectra
Both spectra exhibit characteristic features originating from local absorption of molecular functional groups within the polycarbonate polymer. The nano-FTIR absorption spectrum exhibits bands whose spectral position, linewidth and relative magnitudes compare very well with those measured by standard transmission FTIR or ATR-FTIR (attenuated total reflection-FTIR) on the same material3,4. The simultaneously measured nano-FTIR reflection spectrum, on the other hand, shows the corresponding expected derivative-like features. The comparison of nano-FTIR reflection (red spectrum) and standard FTIR reflection spectrum (blue spectrum) for the polycarbonate sample (Figure 5) reveals excellent agreement for the reflectance spectra obtained by conventional FTIR microspectroscopy and the nano-FTIR reflection spectrum. This finding demonstrates that nano-FTIR absorption spectra and amplitude spectra can be directly compared with standard FTIR transmittance or reflectance spectra for chemical identification of materials3. Moreover, a single nano-FTIR measurement provides local absorption and reflection information simultaneously. To obtain similar information on samples as with conventional FTIR techniques, two independent measurements or a transformation of spectra via a separate mathematical operation (Kramers-Kronig transformation) are required.
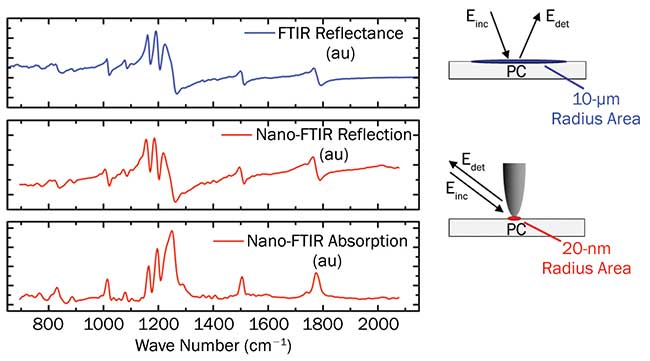
Figure 5. Comparison of conventional FTIR reflection spectrum (blue spectrum) with nano-FTIR absorption and reflection spectra (red) measured on a bulk (5 × 5 × 5 mm) polycarbonate (PC) sample. Excellent agreement between conventional FTIR reflectance and nano-FTIR reflection spectra is visible. Courtesy of Neaspec GmbH.
To demonstrate the extremely high spatial resolution of the nano-FTIR technique, a spectroscopic line scan across an interface between two phase-separated polymers, polymethylmetacrylate and polycarbonate, is performed (Figure 6). AFM allows one to visualize the height difference between the two polymer phases and thus localize the interface between them (Figure 6a, red dashed line). However, due to the lack of chemical sensitivity of the AFM technique, it is not possible to make conclusions about the chemical composition of each side of the interface. Nano-FTIR spectroscopic imaging is ideally suited to answer this question. A high-resolution nano-FTIR spectroscopic line-scan plot acquired along a 500-nm-long line across the polymethylmetacrylate interface (Figure 6a, white dashed line) is shown in Figure 6b. The spatial separation between each recorded spectra is 20 nm. The nano-FTIR line scan allows direct distinguishing between the two polymers based on the change in the local chemical composition.
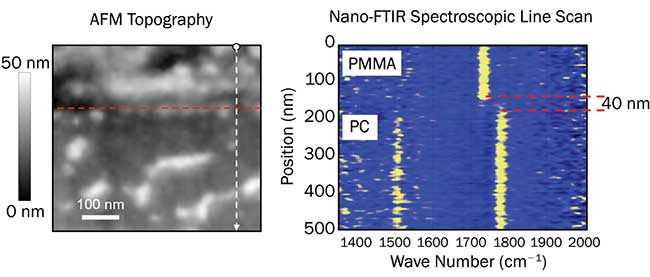
Figure 6. Demonstration of high-resolution nano-FTIR spectroscopic mapping across a sharp interface between two phase-separated polymer films consisting of polymethylmethacrylate (PMMA) and polycarbonate (PC). The interface between the two polymers can be identified in the AFM topography image (a) (red dashed line). Due to lack of chemical sensitivity, chemical assignment is not possible. High-resolution nano-FTIR spectroscopic line-scan plot of 25 individual nano-FTIR absorption spectra is acquired along a 500-nm line across the PMMA/PC interface (a) (white dashed line). Due to the extremely high spatial resolution of about 20 nm in this experiment, it is directly possible to visualize the sharp transition between the two polymer phases based on the change in the local chemical composition. Courtesy of Neaspec GmbH.
Based on the spectral position of the two characteristic absorption lines at about 1500 cm-1 and 1760 cm-1 in the nano-FTIR absorption line scan, the polymer in the lower half can be identified as polycarbonate (compare nano-FTIR absorption spectrum in Figure 5). Furthermore, due to the high spatial resolution of nano-FTIR, the extremely narrow interface region of only 40 nm (2 scan pixels) between the two polymers can be resolved sufficiently, indicating complete phase separation between the two polymer films. It is crucial to underscore that the interface reveals no crosstalk of the spectroscopic signatures, thus demonstrating unambiguously the nanoscale resolution capability of nano-FTIR.
Combining s-SNOM microscopy and an Er-doped fiber laser system proved uniquely suited for nanoscale, near-field FTIR studies in the mid-IR. The technique yielded unprecedented spatial resolution down to 20 nm and monolayer chemical sensitivity, and enabled precise chemical analysis in the mid-IR spectral region of biomaterials, polymers, semiconductors and novel 2D materials on the nanoscale. This way, material properties such as crystallinity, molecular orientation, stress and strain, or free-carrier concentration in a wide range of materials can be identified at critical-length scales of functional nanostructures.
Moreover, in a seminal work by Iban Amenabar and colleagues, the device’s capability for full 2D nano-FTIR spectroscopic mapping (hyperspectral imaging) on multicompound polymer blend and subsequent standard FTIR multivariate data analysis was demonstrated5. Based on these promising results, the authors envision that nano-FTIR hyperspectral imaging will soon become a routine analytical tool for nanoscale material characterization.
Meet the authors
Maximilian Breuer is an application specialist for ultrafast laser systems and customized solutions for scientific and industrial applications at Toptica Photonics AG; email: [email protected].
Matthias Handloser is product manager for ultrafast laser systems at Toptica Photonics AG. He works closely with many leading scientists in the field of ultrafast optics; email: [email protected].
Tobias Gokus is an application engineer at Neaspec GmbH, where he is exploring, together with scientists, new applications for Neaspec’s near-field imaging and spectroscopy technology; email: [email protected].
Acknowledgments
The authors thank Dr. H. Linnenbank and professor H. Gießen (Uni Stuttgart, 4th Physics Institute) for providing the far-field FTIR reflectance spectrum of the PC sample.
References
1. F. Keilmann and R. Hillenbrand (2004). Near-field microscopy by elastic light scattering from a tip. Phil Trans R Soc Lond A, Vol. 362, p. 787.
2. S. Amarie and F. Keilmann (2011). Broadband-infrared assessment of phonon resonance in scattering-type near-field microscopy. Phys Rev B, Vol. 83, Issue 4.
3. F. Huth et al. (2012). Nano-FTIR absorption spectroscopy of molecular fingerprints at 20 nm spatial resolution. Nano Lett, Vol. 12, Issue 8, p. 3973.
4. I. Amenabar et al. (2013). Structural analysis and mapping of individual protein complexes by infrared nanospectroscopy. Nat Commun, Vol. 4, article no. 2890.
5. I. Amenabar et al. (2017). Hyperspectral infrared nanoimaging of organic samples based on Fourier transform infrared nanospectroscopy. Nat Commun, Vol. 8, article no. 14402.