Nanotechnology helps make gene analysis a truly high-throughput method.
Weiming Ruan, Children’s Hospital Oakland Research Institute, P. Scott Eastman, Tethys Bioscience, and Fanqing Frank Chen, Lawrence Berkeley National Laboratory
Genes carry information that controls the physical development and
behavior of every biological organism. Gene expression changes dynamically in living
cells and manifests as patterns with numerous combinations, reflecting the physiological
states. Therefore, understanding gene expression and its variations would provide
critical insights into the mystery of life.
Gene expression analysis allows functional characterization
of genes, molecular diagnostics, pharmacogenomic and toxicogenomic screening, delineation
of molecular pathways, genotyping and mutation detection. These findings would pave
the way for biomarker profiling, drug discovery, disease control and the development
of individualized medicine.
Traditional methods of assaying genes
are usually based on the concept of “one gene, one assay,” which is
inherently low throughput and can’t measure the whole scheme of gene functions
comprehensively. Real-time quantitative polymerase chain reaction (PCR) is one of
the most well-known and widely utilized examples of this type of assay. However,
the genetic information network is complex and consists of thousands of genes that
are interconnected in a highly regulated fashion, even for lower organisms such
as bacteria.
Despite efforts to broaden the multiplexing
capability of quantitative PCR, it can screen only as many as four to six genes
per assay — far from enough to cope with the challenge of modern quantitative
biology. For this reason, many techniques for global gene expression profiling (or
so-called high-throughput methods) have emerged on stage in the past decade. Among
them, the DNA microarray, which has become the most popularly used approach.
Similar to the initial step of quantitative
PCR, in which messenger RNA is first reverse-transcribed into cDNA and subsequently
amplified, a DNA microarray involves labeling amplified DNA molecules with a tag
molecule and hybridizing them to nucleic acid probes. The tags can be quantitated
in a secondary detection system, usually by reading their intensity of fluorescence.
DNA microarrays allow massively parallel
gene expression analysis (up to a million probes featuring tens of thousands of
genes in a given organism) on a single microchip. Each probe representing a gene
is assigned a location on the array by either physical delivery — mechanical
spotting, ink-jet printing — or in situ synthesis — photolithography,
electrochemical synthesis. The technique allows molecular biologists to analyze
every gene present in a genome and, in recent years, has expanded into areas such
as proteins, small molecules, polysaccharides, lipids, metabolites and even tissue
samples.
Despite their wide applications, many
drawbacks have been described, including variable reliability of differential expression
data, expensive equipment for manufacturing and reading the chips, and discrepancies
in calculation for changes in a given gene. Photobleaching also is a major problem
for fluorescence-based microarrays, severely limiting sensitivity and quantitation.
Lastly, the microarray platform uses a fixed assay and is limited to the assays
on the chip, and it is inconvenient to change the gene panels. Therefore, it is
not economical to perform assays on a small number of genes. These shortcomings
prevent the DNA microarray from reaching its potential.
Many detection assays are performed
with reaction volumes in the microliter range and RNA samples of micrograms. Detecting
biological samples at such extremely low amounts is a major challenge for clinical
diagnosis and drug tests. Thus, the next-generation tools for gene analysis must
be more sensitive, more flexible and less costly, while maintaining data accuracy
and reliability.
Label detection is a key determinant
of sensitivity. The most commonly used labels in biological diagnostics are organic
fluorescent dyes. Although new types of fluorescent microscopes and techniques have
pushed the resolution well below the diffraction limit of light, fluorescent probes
have not followed the same impressive evolution trend. Organic dyes still suffer
from notorious limitations such as photobleaching and discrete excitation bands
that preclude their use in many applications.
Quantum dots for biolabeling
Nanotechnology based on inorganic semiconductor
quantum dots might overcome some of these limitations and provide a new scheme of
biolabeling. Quantum dots can be formed by a core of cadmium-selenide nanocrystals
(diameters of 2 to 10 nm) encapsulated with a zinc-sulfide shell so that they are
quantumly confined, leading to a fluorescence quantum yield of more than 50 percent
(for review, see ref. 1).
The extinction coefficient of the nanocrystals
is many times higher than that of an organic dye molecule, making quantum dots incredibly
bright. The size of the core determines the absorption and emission wavelengths
by means of the quantum-mechanical confinement of the optical excitation energy;
hence, the name “quantum dot.” The smaller the nanocrystal, the greater
the confinement energy, and the higher the energy, the shorter the wavelength of
the light it emits.
Quantum dots possess many unique optical
and electronic properties that make them attractive for biolabeling: a broad excitation
spectrum, narrow and precisely tunable emission, and improved signal brightness.
In addition, their colors can be readily changed by simply varying the size of the
nanoparticles (Figure 1). Another unique advantage is that they are extremely resistant
to photobleaching, allowing them to keep emission intensity for hours in contrast
to minutes for regular organic dyes and making them suitable for quantitative analysis.
Finally, by using various size CdSe/ZnS quantum dots, simultaneous excitation of
multiple fluorescent colors can be achieved with a single light source in the blue
to UV range (usually 405 nm), simplifying the requirement on light sources and instruments.
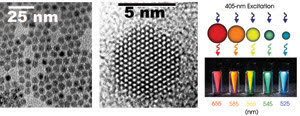
Figure 1. Single nanocrystals of a CdSe-core,
ZnS-shell semiconductor, or quantum dots (left), can be excited by a single light
source (typically at 405 nm). Various size quantum dots can be excited simultaneously
by the light source, and the emission wavelength can be tuned from 400 to 850 nm
by increasing the size of the nanocrystal.
Quantum dots can be attached to a wide
variety of biomolecules, including DNA, proteins, antibodies and short peptides.
For microarray applications, thousands of genes or more must be analyzed simultaneously,
requiring multiplexing in the range of at least a few thousand. However, a drawback
for quantum dot multiplex labeling is that up to only 12 colors can be used in the
light-emitting range of 400 to 850 nm, with the narrower emission peaks of quantum
dots. Even though this is an impressively improved number from that of the conventional
organic dyes, it still is not enough to accommodate the multiplexity requirements
at a global-analysis level.
Barcoded beads
Thus, Shuming Nie’s group at Georgia Institute
of Technology and at Emory University School of Medicine, both in Atlanta, proposed
using a combination of colors of quantum dots and various intensity levels as a
solution to generate the necessary number of signals.2 They created barcodes using
1.2-mm polystyrene microspheres containing three colors of quantum dots in controlled
ratios. Each type of quantum dot in the bead has 10 intensity levels, creating a
quantum dot-based nanobarcode with ~1000 combinatorial possibilities. Because of
the unique spectral properties of quantum dots, this technology has tremendous multiplexing
capability to shed light on genomics and high-throughout screening. For example,
a six-color/10-intensity-level combination can theoretically make up ~1 million
codes.
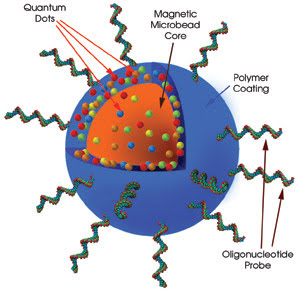
Figure 2. In the quantum-dot-based system, a nanobarcoded microbead is conjugated with
a specific oligonucleotide probe. Each barcode has a magnetic microbead core to
enable easy manipulation by robotics. Quantum dots of various colors are mixed at
various ratios with a polymer and coated onto the magnetic bead. DNA oligonucleotide
probes that can read genes are attached to the polymer surface. Each nanobarcode
has a unique gene probe.
Recently, we turned this concept into
one that could be used in commercial instruments and developed a different nanobarcoded
bead platform that can not only identify, but also accurately quantify the gene
expression variations in a high-throughput and multiplexed format.3 We used 8-mm-diameter
magnetic beads as the core to achieve convenient manipulation and automation during
liquid handling and to lower the background signal because unbound samples can be
washed off easily when subject to a magnetic field. Four fluorescent colors of quantum
dots, with emissions at 525, 545, 565 and 585 nm, and 20-nm spacing between the
peak wavelengths, were mixed with a polymer and coated onto the microbeads at controlled
ratios (Figures 2 and 3).
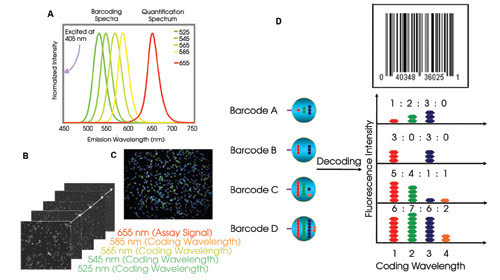
Figure 3. Four colors
(525, 545, 565 and 585 nm) are used for barcoding the quantum dots, and a fifth
quantum dot that emits at 655 nm is conjugated to streptavidin and used for quantification
of the biotin-tagged cRNAs that are captured on individual beads (Figure 4) (A).
The barcode can be magnetically sedimented on a microplate and imaged. The fluorescence
intensity of individual wavelengths (525 to 585 nm) can be measured to allow the
nanobarcodes to be identified (first four rectangular view fields in the front).
In addition, the 655-nm-light intensity can be used to quantify the biotinylated-cRNA
captured on the beads (B). A raw image shows one captured view field of barcodes
(C). Optical coding is based on quantum dot color and on its intensity levels (525
to 585 nm) (D).
We achieved 12 intensity levels for
each color quantum dot, for a panel of hundreds of barcoded microbeads. With each
bead conjugated to an oligonucleotide probe specific to a single gene, the panel
allows hundreds of genes in a sample to be monitored simultaneously.
Assaying genes is simple with this
method. The messenger RNA of the analytic samples is reverse-transcribed, amplified
and converted into the cRNA form, during which the cRNA is tagged by biotin. After
the biotin-cRNA has been hybridized with gene probes on the microbeads, a fifth
streptavidin 655-nm quantum dot binds to the biotin on the cRNA, acting as a quantification
reporter. The biotin-cRNA is thus sandwiched between the barcoded microbead and
the streptavidin quantum dot reporter (Figure 4), creating the “sandwich assay.”
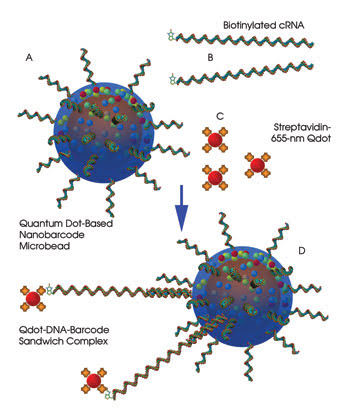
Figure 4. For gene analysis with a sandwich
assay, the barcode-attached oligonucleotide probes capture biotin-tagged cRNA samples
through sequence complementation (hybridization), and the 655-nm streptavidin quantum
dots bind to the biotin on cRNA. Each gene’s cRNA can be decoded by the barcodes
in the sandwiched complex, and the quantity of the cRNA can be determined by the
emission intensity of the 655-nm quantum dot.
There are many advantages of the nanobarcode
microbead system over the DNA microarray and quantitative PCR platforms. Quality
control is easier and cheaper. Each nanobarcode can be made in 1-g quantities, enough
to perform at least 109 assays. Each panel can be assembled with precalibrated barcodes,
meeting most stringent FDA requirements, while each microarray chip requires careful
calibration before use.
In the microbead system, the relative
quantification level for gene expression is a single gene copy per cell, providing
the sensitivity of 103 to 104 detectable target molecules. That level is higher
than 105, achievable with a commercial high-density microarray system and equal
to what is usually observed for quantitative PCR.
High precision
The technique has a dynamic range of 3.5 logs,
which, although not as good as the 6 logs achievable by quantitative PCR, is better
than the 2 to 3 logs observed on various microarray platforms. Because the hybridization
reaction in the microbead system is performed in liquid phase, it can be completed
in one hour. This is at least one order of magnitude faster than microarray-based
hybridizations, which are slowed by the physical interaction between solid phase-immobilized
probes and a liquid-phase gene target. Detectable fold change is lower than 1.4,
according to spike-in experiments, showing high precision even at close to a single-copy-per-cell
level. Reproducibility for this proof-of-concept study is close to that of an Affymetrix
UK Ltd. GeneChip microarray, with an R2 value between two repeats at 0.984 and an
interwell coefficient of variation of less than 5 percent.
In a validation study with the GeneChip
platform, we investigated gene-expression fold changes for a panel of ~100 genes
and found the correlation coefficient >0.90, which is satisfactory and similar
to what we observed when comparing quantitative PCR with the microarray. In addition,
the nanobarcode system uses only 1/20 the amount of sample RNA of that used in the microarray system, suggesting better efficiency to detect traces of starting materials.
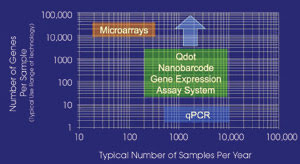
Figure 5. A nanobarcode is competitive with quantitative PCR and
a microarray in cost, speed and sensitivity.
The nanobarcode system is flexible.
A new barcoded genetic probe can be made within hours and “dialed in”
to the existing panel of nanobarcodes. Consequently, users can quickly assemble
their own panel of gene probes.
Recently, flexible microarrays have
been developed, but they require expensive instruments. As another popular gene
expression analysis tool, quantitative PCR lacks the ability to normalize between
genes and internal precision and resolution to allow for measurement of small changes
of mRNA expression. Therefore, neither microarrays nor quantitative PCR technologies
provide enough internal technical replicates, calibrators or controls to monitor
the quality of experimental data. The flexibility could allow costs for the nanobarcode
assay to be much lower; a set of 100 genes can have a price comparable to a multiplexed
quantitative PCR assay.
Some commercial bead assays use a randomly
assembled array in wells that code the beads with oligonucleotide zip codes. Even
though this approach has been shown to have whole-genome-encoding capacity, it requires
a decoding hybridization for each chip. Another platform uses dual-color bead assays
involving antibodies, enzymes, toxins and nucleic acids; however, the photoinstability
of dye in the beads makes quantification less reproducible, and the multiplexity
is difficult to expand because of the broad bandwidth of the conventional fluorophores
used in the beads.
Future applications of the quantum
dot microbead system include genotyping, especially single nucleotide polymorphisms.
When the oligonucleotide probes are replaced by peptides, antibodies, aptamers or
other affinity capturing agents, we can perform multiplexed protein assays based
on affinity capture. This newly developed technique may be routinely applied to
clinical diagnostics, biomarker screening, toxicogenomics, gene expression screening
or microbiology screening, even including biodefense, at much lower cost and greater
accuracy than technologies currently in use. At the same time, more information
from limited amounts of samples and compounds can be obtained because of its high
sensitivity.
The nanobarcode system provides an
attractive alternative to conventional genetic analysis tools and promises to be
a key biotechnology platform.
Meet the authors
Weiming Ruan is a research fellow at Children’s
Hospital Oakland Research Institute in California.; e-mail: [email protected].
P. Scott Eastman is senior scientist
at Tethys Bioscience in Emeryville, Calif.; e-mail: [email protected].
Fanqing Frank Chen is a scientist at
Lawrence Berkeley National Laboratory in California; e-mail: [email protected].
References
1. P. Alivisatos (January 2004). The use of nanocrystals
in biological detection. Nature Biotechnol, Vol. 22, pp. 47-52.
2. M. Han et al (July 2001). Quantum-dot-tagged
microbeads for multiplexed optical coding of biomolecules. Nature Biotechnol,
Vol. 19, pp. 631-635.
3. P.S. Eastman et al (May 2006). Qdot
nanobarcodes for multiplexed gene expression analysis. NANO LETTERS, Vol.