Critical advances will allow nondestructive monitoring of agricultural products.
DIETER BINGEMANN, OCEAN OPTICS INC.
Near-infrared (NIR) spectroscopy is well-suited to analysis of bulk, high-moisture agricultural samples such as fruit, grains, fish and meat. Light at NIR wavelengths penetrates samples with less scattering than other techniques, allowing internal composition to be analyzed nondestructively. Although NIR spectra are often broad, overlapping and complex, statistical modeling can be used to unlock their secrets.
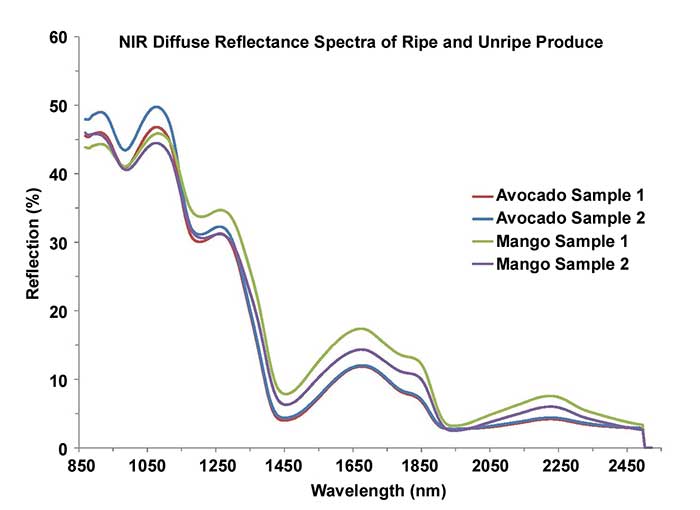
Figure 1. Longer NIR wavelengths that
aren’t scattered by the surface of fruit samples pass through the peel
to reveal characteristics of the pulp underneath. Courtesy of Ocean
Optics.
NIR spectroscopy measures the vibrational overtone absorption of chemical bonds, mainly C-H, O-H and N-H, which comprise most of the chemical constituents in agricultural products. Chemometric models process NIR reflectance spectra to extract quantitative and qualitative answers on sample characteristics including moisture and protein content, sweetness and variety.
NIR’s agricultural applications
NIR spectroscopy has been used since the 1970s for the analysis of agricultural products. Spectral data for NIR light reflected from an agricultural sample such as grain or produce is acquired and compared with a calibration model generated from spectral data of samples with known levels of the constituents of interest.
For fruit or produce covered by a peel, the longer wavelengths used for NIR analysis are weakly absorbed; they pass through the peel, enabling sampling of the fruit pulp beneath (Figure 1). Little or no sample preparation is required. The measurement of NIR reflection is rapid and nondestructive. With the assistance of carefully constructed calibration models, it is also quantitative.
The NIR region extends from 780 to 2500 nm. Absorption of light in this region causes molecules to vibrate, resulting in spectral data with features dependent on the chemical composition of the sample. In the case of agricultural samples, the NIR spectra typically comprise broad peaks because of overlapping absorptions caused by overtones and combinations of vibrational modes of organic functional groups with C-H, O-H, or N-H chemical bonds. The NIR spectrum provides a snapshot of the sample with information for multiple components available in a single NIR spectrum. These are among the characteristics that make modern NIR spectroscopy instrumentation very useful for agricultural monitoring.
With fruit and produce, starches and sugars (primarily fructose, glucose and sucrose) are commonly measured to determine fruit maturity and quality. Starch, for example, has some specific wavelengths that enable construction of a multi-parametric model that can be used to determine fruit quality.
Many NIR spectrometers have the necessary spectral response to detect critical starch peaks near 1722 nm, 2100 nm and 2139 nm, as well as sugar peaks that occur primarily between 900 and 1200 nm (some peaks also occur >2100 nm). Modularity in some NIR spectrometer optical designs allows users to adjust spectral range, slit width and other configuration parameters in order to optimize system performance.
For grains, NIR spectroscopy techniques enable quick characterization of samples for moisture, protein, fat and starch content, with quantitative results obtained using statistical modeling and the appropriate calibration protocols for the parameters of interest (Figure 2).
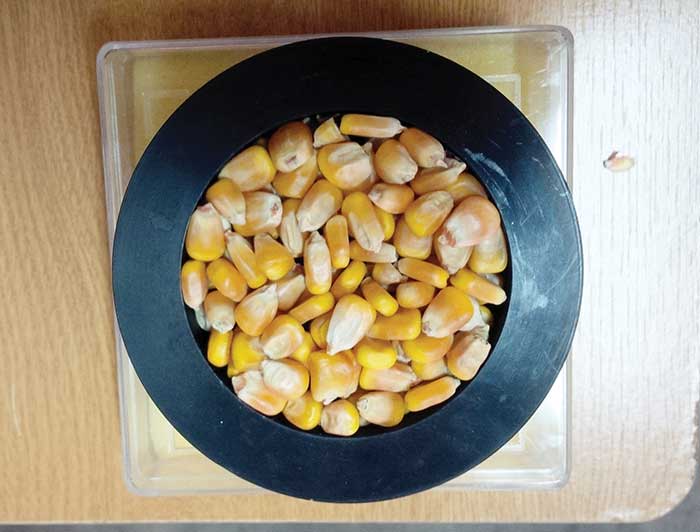
Figure 2. With appropriate chemometric modeling and sampling techniques, NIR reflectance of complex samples such as corn kernels can account for variance from kernel to kernel. Courtesy of TecnoCientifica.
The techniques are used during grain processing and in storage, and can determine nutritional content data for product labeling. NIR spectroscopy also plays an important role in quality control and the classification of finished goods, including sorting gluten-free from standard grains. Information obtained from NIR measurements is vital for regulatory agencies such as the U.S. Department of Agriculture.
Moisture content analysis of grains is important for determining proper product handling during processing to avoid spoilage by mold or fungi. Moisture analysis also provides information used to determine the types of grains best suited for a particular use or type of grinding. In addition, moisture content is used to determine if processes such as freeze-drying should be employed to preserve the grains.
NIR and chemometrics
NIR spectroscopy sits in a slightly awkward wavelength space between ultraviolet-visible and infrared absorbance spectroscopy, both of which are commonplace in analytical laboratories. NIR spectroscopy has enormous potential for a variety of agricultural applications, and is more accessible than ever thanks to the availability of compact, high-value NIR spectrometers.
Just as the analysis of NIR spectra is conducted a little bit differently than in the UV-VIS or mid-IR, so is the measurement. This is not necessarily an issue for most applications, as the benefits are clear, particularly for opaque samples, powders and grains. These types of samples yield too much scattering when studied with visible spectroscopy and too much absorbance when probed using infrared light. NIR spectroscopy hits the sweet spot where the two effects balance and yield a useful measurement, with the additional bonus being that no sample preparation is needed prior to measurement.
NIR measurements are often performed using a diffuse reflection setup, with a reflectance standard used as a reference. Illumination can be integrated with light delivery via a probe or other accessory, or routed from a tungsten halogen or comparable light source to the sample via a reflection probe.
These measurements also can be made in transmission. A third option is “interactance” mode, which is a combination of reflection and transmission. In interactance mode, the illumination and detection optics are slightly separated on the same surface to capture light that has scattered deeper into the material and returned to the surface.
This increases the effective pathlength and leads to stronger absorbance signals. In fact, due to multiple scatter events, the pathlength in interactance mode is substantially longer than the physical distance between illumination and collection.
The list of sample properties that can be measured with NIR spectroscopy is lengthy, extending beyond chemical concentrations such as the percentage of moisture, sugar and fat for food and agricultural samples. Chemometrics also enables assessment of characteristics such as density, firmness, temperature or particle size, and even more complex properties like fruit ripeness.
Measurement of such advanced parameters does not rely on assignments of single absorption bands, but rather on a multiwavelength correlation between the spectrum and the actual physical or chemical lab analysis, drawn out and revealed using the tools of chemometrics. Based on multivariate statistics, chemometrics borrows heavily from linear algebra techniques such as principle component analysis to allow qualitative and quantitative predictions of concentration, identity and quality.
In a typical quantitative chemometric analysis, a number of spectra are recorded for a variety of samples spanning a wide range of values for the property of interest, each of which is tagged to the measured value as determined in a subsequent laboratory analysis. The spectra are preprocessed to eliminate setup variations and correlated to the lab results, yielding a model that allows the user to predict the property of interest from the spectrum alone. This prediction is tested with known samples before it is used on unknown samples. To account for long-term changes in the instrument or the seasonality of natural samples, the model needs to undergo continued tests and maintenance with additional validation samples.
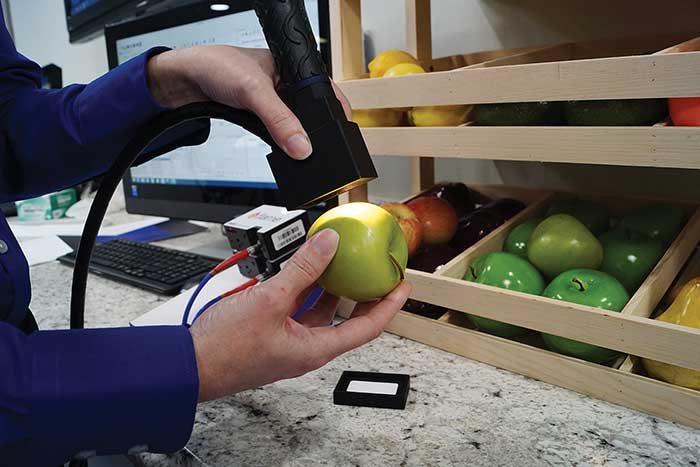
Figure 3. The emergence of compact yet flexible NIR spectrometers and accessories creates an advantage for agricultural sample analysis. Courtesy of Ocean Optics.
The combination of fast, modular NIR spectrometers and powerful chemometrics tools creates new opportunities for rapid, on-site testing of agricultural samples (Figure 3). Additional innovation in NIR spectroscopy includes higher-performing, more affordable detector options; the use of mobile devices for both communications and imaging; and dynamic sampling techniques employed with nonhomogeneous samples such as grains, in which rotational or linear motion is used as a way to remove variance from the results through more representative sampling.
From quick and inexpensive measurements in complex situations, to sample identification and online quality control — the possibilities for NIR spectroscopy are many.
Meet the author
Dieter Bingemann, Ph.D., is a senior application engineer for Ocean Optics in Dunedin, Fla; email: [email protected].
Case Study: Applying Chemometrics to Determine Apple Sweetness
In today’s global food network, some fruit is picked well before maturity and allowed to ripen during transport, while other fruit is stored from season to season to provide a year-round supply. Food quality often takes a back seat to appearance, leaving both consumers and resellers guessing as to the ripeness of the fruit. With chemometric tools, however, one can predict the sweetness of an apple, as well as its nutritional value, by analyzing diffuse reflectance spectra obtained without opening the fruit.
Chemometrics shines where traditional spectroscopic analysis fails, as in the example of NIR diffuse reflectance spectroscopy of an apple. Diffuse reflectance spectra depend on a number of factors that are hard to control, such as the measurement geometry, the size of the scattering particles inside the fruit, and the surface properties of the apple’s skin. NIR spectroscopy also is sensitive to all O-H, N-H, and C-H bond vibrational overtones. Most organic compounds absorb in this spectral range, which leads to broad, seemingly featureless NIR spectra due to the countless overlapping absorption bands.
Chemometrics also helps glean information from NIR absorbance spectra. Unlike IR absorbance spectra, NIR absorbance spectra cannot be assigned readily to individual chemical bonds. However, the development of chemometrics has opened up a treasure trove of spectroscopic information that is easily accessible with sensitive optical spectrometers and affordable light sources.
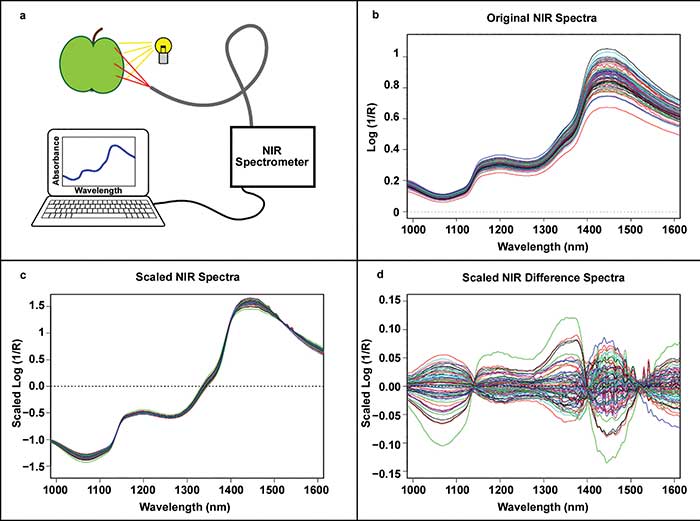
Figure 1. A simple NIR spectrometer setup (a) becomes a sophisticated analytical tool for determining fruit sweetness by recording diffuse reflectance spectra (b) and applying a standard normal variate step that accounts for differences in sampling geometry (c). Differences between the scaled spectra and the overall average spectrum relate to sweetness (d). Courtesy of Ocean Optics.
The sugar content of fruit — mainly fructose, glucose, and sucrose — is commonly measured in sum as the soluble solids content in the expressed fruit juice with a refractometer and reported as degrees Brix (°Bx), or grams of sucrose equivalent per 100 mL. Typical values range from 10 °Bx to 16 °Bx, depending on the apple variety, with unripe and ripe apples of the same variety differing by up to 4 °Bx.
A Brix measurement is time-consuming and requires sacrificial sampling from each batch to perform laboratory analysis of the fruit. Chemometrics using NIR reflectance spectra offers a rapid and nondestructive alternative. A recent case study outlined the typical steps required to develop and test a chemometric model for a complex analyte, such as °Bx.
NIR diffuse reflectance spectra were captured for 76 Ginger Gold apple samples using a miniature spectrometer configured for 950 to 1650 nm and a tungsten halogen light source (Figure 1). Both ripe and unripe apples were used, and their Brix values determined in a separate lab analysis. Spectra from five locations across the “equator” of the apples were averaged for each apple. Because of slight differences in the measurement geometry and the shape of the apple, the spectra appear shifted and scaled relative to each other, which is corrected for in a “preprocessing” step using the standard normal variate method. As only the differences between the spectra contained the information about the varying sweetness, using a process called mean-centering by subtracting the average of all spectra yielded best results.
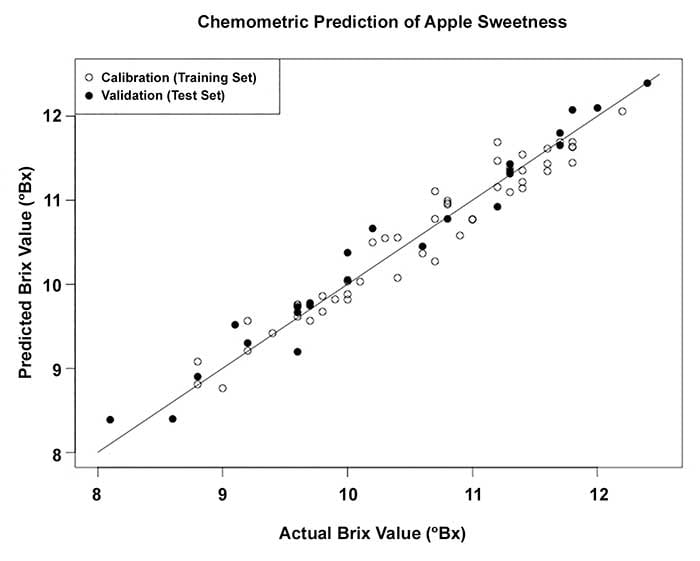
Figure 2. Comparison of the actual sweetness of apples (as measured in a lab as the Brix value) and the prediction of the Brix value based on the NIR diffuse reflectance spectrum. Courtesy of Ocean Optics.
In testing, the data set was split into one-third for the test set and two-thirds for the training set, optimizing the model for the Brix value in repeated cross-validation. Cross-validation helps to walk the fine line between poor prediction in general (underfitting) and poor prediction on unknowns despite good performance on the training set (overfitting). In this case study, the best model performance was achieved by including five components (basis vectors or dimensions) in the model. The quality of the prediction is evident when comparing the apple’s sweetness predicted by the model from the NIR reflectance spectrum with the actual Brix value measured in the lab for both training and test sets (Figure 2). The deviation between predicted and actual values is summarized in the standard error of prediction, a measure of the quality of the model, which is better than 0.3 °Bx in this investigation.