Wavelength-specific filters help to separate fluorescence and excitation light, resulting in less background noise, which facilitates accurate results in real time.
JASON PALIDWAR, IRIDIAN SPECTRAL TECHNOLOGIES
The need to implement technology that can rapidly diagnose diseases and pathogens accurately has never been greater than it is now, as the COVID-19 virus continues to spread around the world. Prior to 2020, most people working outside the field of molecular biology would not have been aware of polymerase chain reaction (PCR) testing and its ability to amplify the presence of biomarkers to enable the optical detection and identification of genetic material from specific organisms, such as viruses. Since millions around the world have become infected with the coronavirus, the broader community has become increasingly aware of PCR as a tool that facilitates the accurate diagnosis of the disease, helping to inform infected persons so that they can subsequently isolate, seek care if needed, and prevent transmission of the virus to others.

A DNA polymerase chain reaction (PCR) multiwall sample plate. Courtesy of iStock.com/jxfzsy.
Use of standard reverse transcription PCR (RT-PCR) for diagnosing diseases such as COVID-19 requires samples to be collected and sent to a centralized laboratory for analysis. Results can take days
to be returned. With a highly transmissible virus such as the one that causes
COVID-19, delayed test results require patients to isolate while awaiting feedback, and the test only provides a result indicative of the patient’s state of infection at the time of the test. A person may become infected or may cross detection thresholds in the gap between testing and obtaining results days later. This time lag has rendered the tests impractical as a tool for screening in real-world environments and therefore necessitates real-time testing alternatives. Some enhancements to standard PCR tests include using optical filters that enhance specificity of the information gathered from a particular sample.
According to the Centers for Disease Control and Prevention and the FDA, the two most commonly used approaches for rapidly diagnosing active infection by the SARS-CoV-2 virus are rapid molecular diagnostic testing and rapid antigen testing. The first detects the presence and load of viral RNA in the sample under examination. The second detects the presence of specific proteins on the surface of viruses.
Rapid antigen testing is fast and capable of producing results in as little as
15 to 30 min. However, the ability of rapid molecular testing, such as quantitative PCR (qPCR), to accurately detect very small amounts of viral RNA has helped to make it the gold standard in COVID-19 testing. While not as fast as rapid antigen testing, some real-time qPCR systems are able to deliver results in <1 h, making it a practical live screening tool for actively infected persons, regardless of whether they are expressing symptoms of infection or not.
How qPCR works
Since its invention in 1983 by Nobel Prize-winner Kary Mullis, RT-PCR has been employed broadly for RNA detection and quantification due to its ability to convert small amounts of RNA into DNA through reverse transcription. Then, the DNA is exponentially replicated into millions of copies, thus amplifying the signal available for analysis.
In this conventional approach, DNA is detected by performing gel electrophoresis at the end of the PCR (so-called end-point analysis), where molecules to be separated are pushed by an electrical field through a gel that contains small pores.
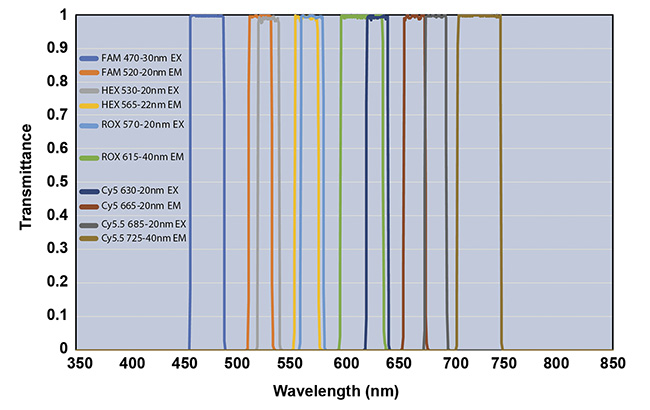
A graph showing the filtering of several excitation wavelengths. Courtesy of Iridian Spectral Technologies.
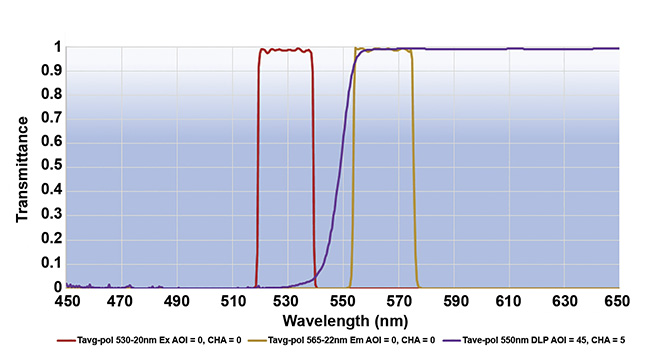
A graph of the spectral curves for a fluorescence filter set: excitation (red), emission (yellow), and dichroic (purple). Courtesy of Iridian Spectral Technologies.
Frequently misunderstood, the “RT” prefix denotes reverse transcription and does not mean “real time.” Real-time qPCR, however, leverages the ability to employ target-specific fluorescence probes, such as TaqMan probes, which, when bound to viral DNA, enable selected detection and quantification of the gene of interest during each amplification cycle. By measuring the fluorescence signal at the end of each amplification cycle, an amplification curve is created and a cycle threshold value at which the fluorescence signal is distinguishable from the background can be determined. This cycle threshold value is inversely proportional to the viral load, so a rapid and quantitative determination can be made of the infection level present in the qPCR assay.
Real-time qPCR instruments consist of the following three components:
• A reaction module or thermocycler in which the samples are heated to specific temperatures to promote the breaking of the weak hydrogen bonds, splitting the sample into single-stranded DNA that is annealed to primers and probes and then extended by polymerase to double the quantity of DNA.
• An optical engine that illuminates the sample and subsequently detects and measures the resulting fluorescence intensity from targets of interest.
• Software to run the system and analyze and interpret the results.
Multiplexing qPCR, or the ability to analyze multiple genetic targets simultaneously, is enabled by the use of target-specific probes that have different fluorescence excitation and emission profiles. However, the optical system must be designed to both illuminate at various excitation wavelengths and discriminate among different emission wavelength bands.
A place for optics
The optical engines of real-time qPCR instruments are essentially just fluorescence detection systems consisting of light sources, beam steering, wavelength-selective elements (including optical filters), and sensors or detectors.
The light sources commonly used in qPCR instruments are LEDs or halogen sources. Various technologies are available for illuminating the sample wells — from individual filtered LEDs or multiple LEDs shuttled between wells or illuminating multiple wells, to systems in which filtered light, whether from an LED or halogen light source, is steered into each sample well. There are many different qPCR instruments (from companies such as Bio-Rad, Life Technologies/Thermo Fisher Scientific, Volpi, and Illumina, to name a few). And while each has its own approach, these instruments typically offer between two and six different excitation colors, depending on what is practically feasible.
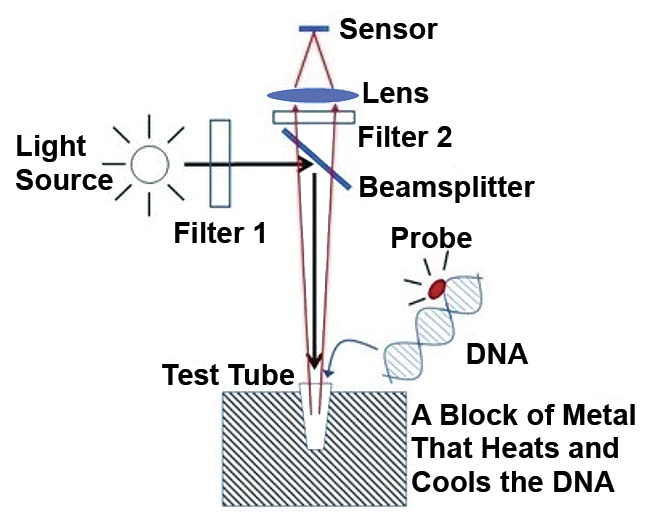
A diagram of a quantitative PCR (qPCR) instrument with optical filters in place. Courtesy of Ronian Siew/Inopticalsolutions.
Once the DNA and its associated probe has been excited, the resulting fluorescence signal is then detected and measured. Detection in qPCR systems is usually achieved either at a discrete wavelength by using filtered photodiodes that specifically measure the signal associated with a given probe, or by using a charge-coupled detector that is filtered to take a digital image of the reaction plate for a given emission wavelength. The specific method used is a design decision that strikes a balance between considerations such as signal sensitivity, speed, and geometry.
Regardless of the source and detector design, real-time qPCR instruments must achieve the most favorable signal-to-noise ratio possible, combined with the utmost sensitivity, to minimize false-positive and false-negative rapid test results and ensure accuracy. This demand for high specificity and sensitivity requires the optimal design and manufacture of the wavelength-selective optical filters used to discriminate the fluorescent emission signals from adjacent fluorochrome channels and excitation light. The filters need to provide more signal with less background.
The demand for high sensitivity requires that the center wavelength and bandwidth of excitation and emission bandpass filters be configured to the specific qPCR instrument’s system, as well as the number of probes/channels the system needs to support. Specifically, the center wavelength and bandwidth for each filter must be designed and manufactured to maximize the transmission of both the excitation and emission signals while blocking “out-of-band” signal. This design should minimize crosstalk between signals occupying the same channel and suppress interference from adjacent signals.
Components working together
Each qPCR instrument relies on its entire optical system of sources, beam steering/selection, and detectors working harmoniously over all the channels of interest. Similarly, the optical filters providing the wavelength selectivity for each channel are best considered as a group or set (excitation, dichroic beamsplitter, and emission filter) rather than as individual components.
As with most fluorescence applications, the excitation and emission bandpass filters and the dichroic filter for each channel perform distinct but interrelated roles. The excitation filter transmits the desired illumination wavelengths and blocks unwanted signals. The emission filter allows only specific wavelengths associated with the desired fluorophore through to the detector. And the dichroic filter is used to steer the different excitation and emission wavelength ranges onto different beam paths, as well as provide some blocking of the excitation light in the emission beam path.
The performance of each filter — excitation, emission, and dichroic — affects, and is affected by, the other filters in each set for a given fluorophore.
Overlap between the source excitation signal and the desired fluorescence emission signal band will interfere with detection of the emission signal. As a consequence, it is critical to use bandpass filters with very steep edges, providing improved signal isolation due to high transmission in the passband and deep blocking outside the passband. Standard, commercial off-the-shelf filters may be adequate in some applications, but more than 90% of optical filters in qPCR instruments require some form of customization to fulfill their intended price-performance balance. Typically, wavelength range and center wavelength are the most common specification customizations applied to qPCR filters; however, bandwidth, transmission level, and reflection level are also important parameters to determine, depending on the application.
Quality qPCR instrumentation, like most commercial applications, is served best by components that strike the optimal balance between technical performance and commercial availability. Because each channel on a qPCR instrument can be so spectrally close to its neighbors, technological challenges arise, particularly as more channels are added. Resolution of these challenges can add to technical complexity of the filters in terms of edge steepness, driving increased layer counts and thus higher cost — particularly when considering that most bandpass and dichroic filters for these instruments require a custom design, integrating new fluorescence probes and/or wavelengths.
Manufacturers are constantly working to produce filters that provide better resolution at lower costs to support the increased demand for faster, more-accurate tests.
Meet the author
Jason Palidwar joined Iridian Spectral Technologies in 2006 and is currently product group manager of Aerospace and Specialty Optics, with a focus on optical filters for use in satcom and Earth observation. He has over 20 years of experience working with thin-film optical filters and has developed filter specifications together with Iridian’s customers to optimize solutions for a wide range of technical and commercial needs in applications such as telecom, Raman spectroscopy, fluorescence microscopy, 3D entertainment, and IR remote sensing. Palidwar has a Master of Science degree in physics from McMaster University; email: [email protected].