Ensuring optimal performance for an optical component requires establishing well-defined processes that address four fundamentals of measurement.
MARK MALBURG AND MIKE ZECCHINO, DIGITAL METROLOGY SOLUTIONS
Today’s instruments for measuring optical components deliver
increasingly higher resolution, larger measurement areas, and greater analysis functions. In addition to improving results, the added sensitivity and analysis options can also increase measurement variability, which can inadvertently raise the number of good components that must be reworked or scrapped.
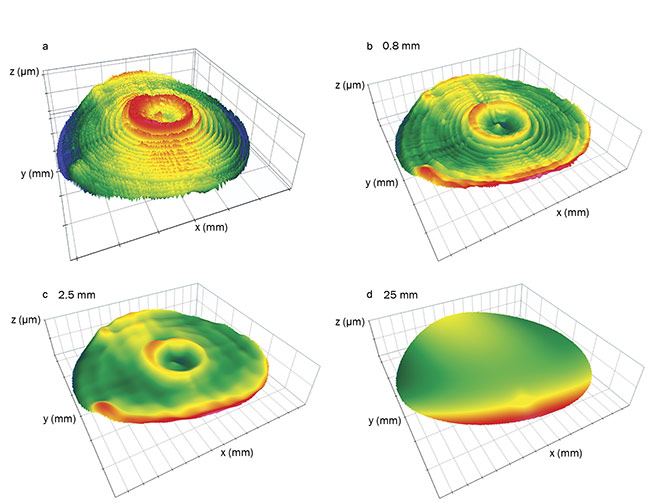
A raw measurement of an optical surface (a) is decomposed into various wavelength regimes — roughness (b), mid-spatial (c), and form (d) — using filtering. Establishing well-defined procedures for filtering and other basic aspects of data analysis ensures consistent results. Courtesy of Digital Metrology Solutions.
Harnessing the power of new measurement instruments and software requires establishing well-defined processes. To ensure consistent results, these processes must address the following four basic measurement fundamentals:
- Preprocessing of the data to account for unusable pixels.
-
Geometry fitting to assess the overall surface shape.
-
Filtering to highlight the aspects
of the data that matter for the
application.
-
Parameterization to allow those aspects of the data to be traced and controlled.
Preprocessing surface data
The first step in data analysis typically aims to replace missing pixels and remove pixels with errant values. A measurement system may not detect data at certain pixels due to steep slopes, surface contamination, or other issues. An instrument may misrepresent the height of individual pixels due to imaging or detection problems, resulting in outliers. Most modern analysis software includes methods for interpolating missing pixels based on the nearest surrounding data. Interpolation can improve visualizations and, when performed correctly, has minimal impact on computed parameters.
Outlying points can be dealt with by various approaches, depending on the types of the outliers. The most common
method for correcting single-pixel outliers is to apply a median filter, which replaces an outlier with the median of the surrounding pixels (typically 3 × 3 or 5 × 5 pixels). As Figure 1 shows, when the outlying data points (spikes in the left image) are removed by a median filter, the true structure of the surface becomes apparent (right). Other methods for addressing outliers include threshold-based methods and robust filtering.
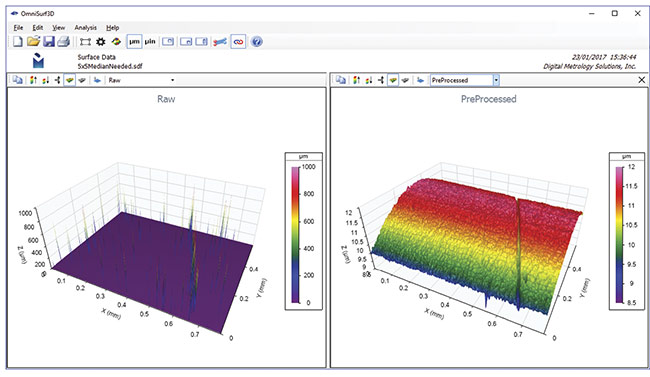
Figure 1. A median filter is applied to noisy data (left) to remove outlying points. Once these outliers are removed, the overall cylinder (right) becomes apparent. Courtesy of Digital Metrology Solutions.
Another recently developed method enables a user to interactively repair individual outliers. The process is useful when outlying data is wider than a
median filter can correct, or when the
outlying data is very similar to actual
surface features that need to be retained. Figure 2 illustrates this interactive process in which the user highlights and repairs an individual data spike.
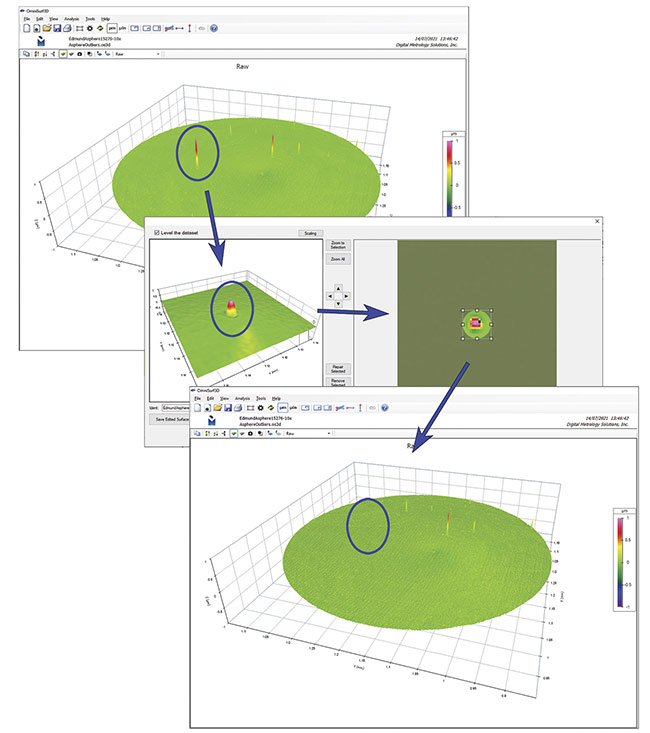
Figure 2. Outlying data points can also be corrected individually using an interactive repair tool. Courtesy of Digital Metrology Solutions.
Regardless of the method used, the pertinent details of the operation, such
as the filter type and window size, must be specified to ensure repeatable and comparable results. Pixel-based filters such as the median filter can act very differently when using different camera resolutions, so these values should also be included in the measurement specification.
Fitting the geometry
An optical component’s surface is
designed to achieve a particular set of
optical and mechanical properties. To
verify the quality of the surface, the
designed shape is subtracted from the measured shape, leaving behind the
errors, or residuals. Traditionally, optical surface shapes were approximated using basic geometries such as cylinders or spheres. Modern optical surfaces, however, vary widely in shape, including aspheric surfaces, which require multiple equations to fully describe. Freeform optics have shapes that cannot be defined strictly by mathematical equations; in these instances, CAD models or point clouds are used to describe the nominal, or ideal, geometry. The analysis software fits the designed geometry to the measured data using various methods, a least-squares fit being most common for optical components. After fitting, the residual errors are reported.
The direction in which the errors are calculated can greatly affect the reported results. The top image of Figure 3 shows errors reported along the optical axis. Axial residuals will have the same area, or length, as the input data and may be of interest in some machine compensation applications. The error map shown in the bottom image is based on perpendicular residuals and is larger laterally, as it represents the unrolling of the surface. The perpendicular residuals map is often more important in modeling, in which an error surface is applied to (or wrapped around) a nominal geometry. In either case, the direction should be specified in the measurement procedure to ensure equivalent results.
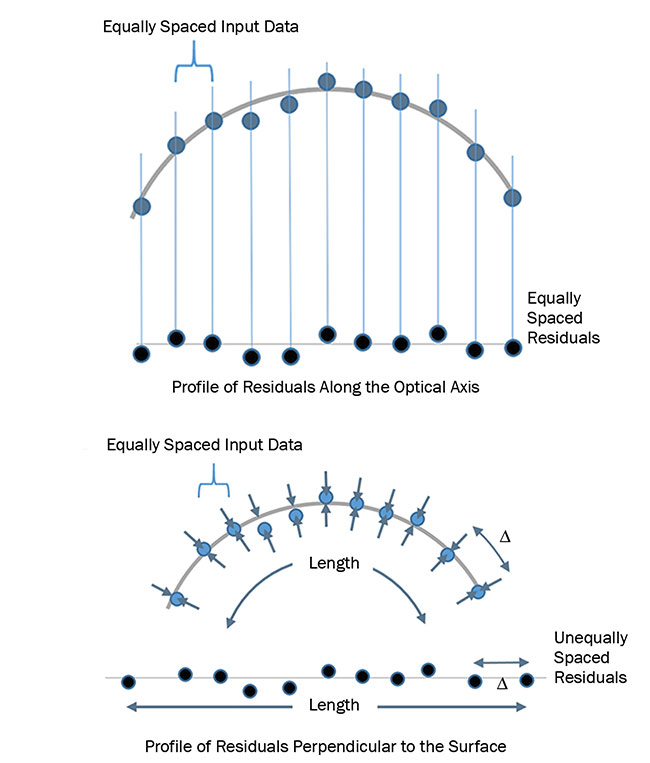
Figure 3. Measuring residual errors along the optical axis produces different results than measuring errors perpendicular to the surface. Used with permission from Reference 1. Courtesy of Carl Musolff and Mark Malburg.
Filtering
Surface error, or surface texture, consists of a spectrum of wavelengths, ranging from short-wavelength roughness through long-wavelength form. The spectrum is also often described by frequency (1/wavelength), but the use of the surface wavelength is also gaining popularity.
The application for a particular optical component dictates which of these surface wavelength regimes must be specified and controlled for that component. Short-wavelength roughness may be critical for components that transmit high energy; longer-wavelength form may be most important for focal systems. Most components require some independent degree
of control over both regimes.
Filtering is the process by which the wavelength/frequency regions of interest are defined. The ISO 16610 series of standards describes these filters in detail. Cutoff wavelengths (or cutoff frequencies) define the regions and enable analysis of surface roughness and form independently.
A short filter can be used to suppress or filter out short-wavelength, high-frequency features such as noise. A long filter will remove the long-wavelength
or low-frequency influences in the data.
Gaussian filters are most commonly used to analyze 2D and 3D surfaces. These filters are based on a Gaussian convolution, or the weighted moving average, through the data set. Various methods are employed by software developers to handle the end/edge regions (Figure 4). It is important to understand, and specify, the treatment of these edge regions to establish comparable measurements between instruments.
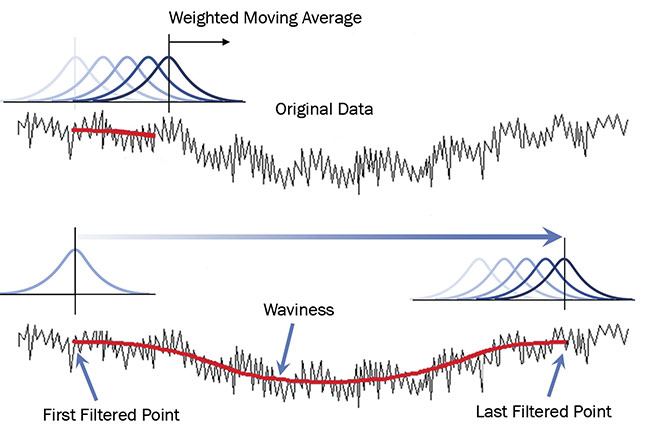
Figure 4. A Gaussian filter consists of a weighted moving average passing through the data. Used with permission from Reference 1. Courtesy of Carl Musolff and Mark Malburg.
As an example of how filter settings dramatically affect data, consider the surface in Figure 5.
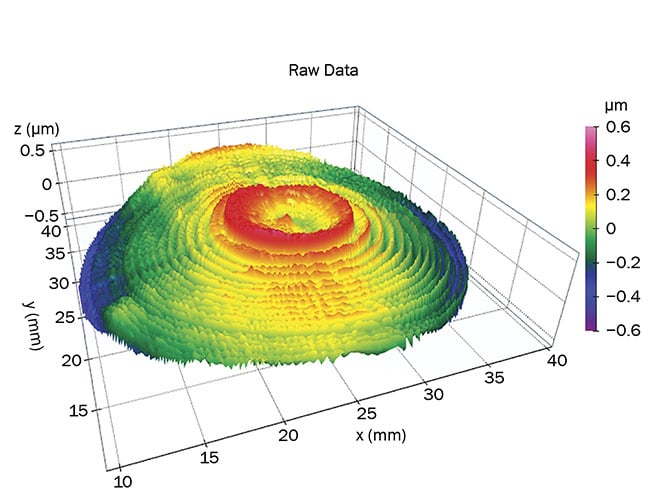
Figure 5. A surface consisting of prominent features in several wavelength regimes. Courtesy of Digital Metrology Solutions.
Setting the short filter cutoff to 0.25 mm and the long cutoff to 2.5 mm isolates the tool marks on the example surface (Figure 6, top). If, instead, the filter cutoffs are set to 2.5 and 25 mm, the result looks very different. Now the mid-spatial features, which may be related to tool chatter or machine vibration during manufacturing, dominate the data (bottom).
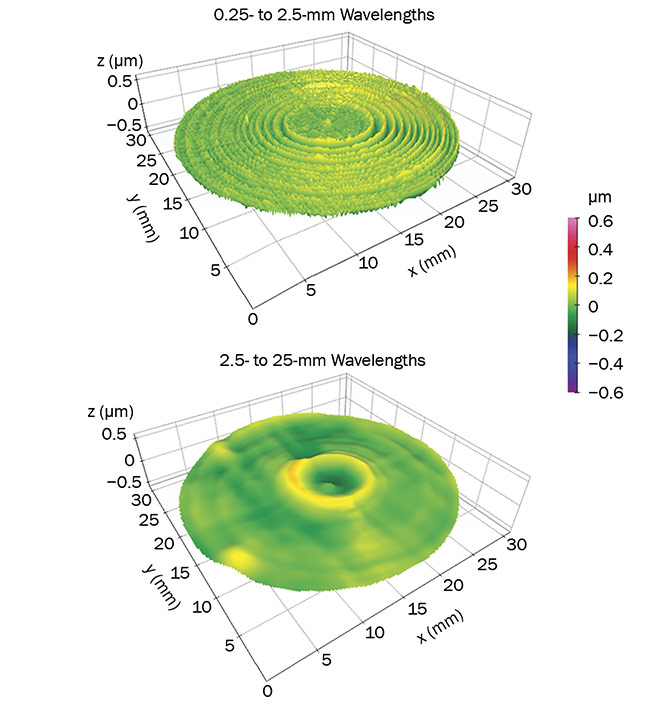
Figure 6. Tool marks are visible when wavelengths from 0.25 to 2.5 mm are displayed (top). Tool chatter and vibration become visible in the band from 2.5 to 25 mm (bottom). Courtesy of Digital Metrology Solutions.
In addition to filter wavelength settings, analysis software also typically offers an array of filter types. In most optical applications, the short filter is a Gaussian filter, which provides the sharpest (steepest) possible transmission curve while not introducing digital artifacts. Recent advancements in filtering put forth in the ISO 16610 standards include an option for a second-order Gaussian
filter, which is more capable of representing underlying curvatures. This type of filter can be useful on geometries with sharper curvatures and can therefore be beneficial in many of today’s applications.
For the data to be meaningful, a
measurement process must specify both
the type of cutoff filters and their wavelengths/frequencies. Without this information, results can vary dramatically (as shown in Figure 6), leading to wildly different conclusions about the quality of the component.
Specifying parameters
Once measurement and analysis
variability has been minimized, it is
then possible to specify parameters to describe the surface shape and errors that matter for the application. Most software packages provide a range of parameters, each of which should be based in standards developed by nationally and internationally recognized bodies such as ISO.
Knowing which parameters to specify and control can be complex. The most commonly used measure of figure error is the total peak-to-valley height. In the context of the ISO 25178 standards, this parameter is referred to as Sz, but it is also reported as St by many instruments and software packages. The Sz parameter simply reports the worst peak-to-valley deviation; as such, it does not provide
a clear description of the surface. For example, the Sz parameter cannot distinguish between an astigmatic error and an error due to a single, narrow spike on the surface.
Another common approach is to specify the root mean square (rms), or standard deviation, of the surface errors. This is the Sq parameter, per ISO 25178. Sq is more indicative of the typical errors over the surface, whereas Sz only references the two most extreme data points.
In recent years, other parameters have been introduced to better describe the actual function of the component, as
opposed to simple height values. Some of these parameters address surface aspects such as spacings and curvatures, while others are more indicative of directionalities or slope.
Most recently, attention is being given to relatively sharp, outward optical component features that can cause distortions in the light that passes through the component. Morphological filtering has shown great promise for isolating these features. In Figure 7, a morphological opening filter of a given radius is
applied to the measured data, resulting
in a filtered opening surface. The outward features are extracted based on the difference between the opening surface and the measured surface.
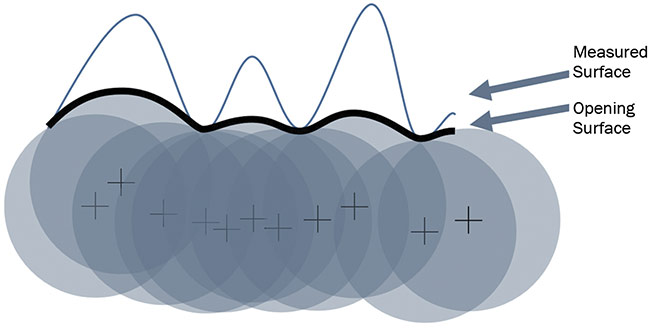
Figure 7. A morphological opening filter can isolate sharp, outward features that can cause distortions. Used with permission from Reference 1. Courtesy of Carl Musolff and Mark Malburg.
In Figure 8, a morphological opening
filter is applied to the surface on the left.
The right plot shows the difference between the measured and opening surfaces, which represents the peaks that are sharper than the radius of the opening filter.
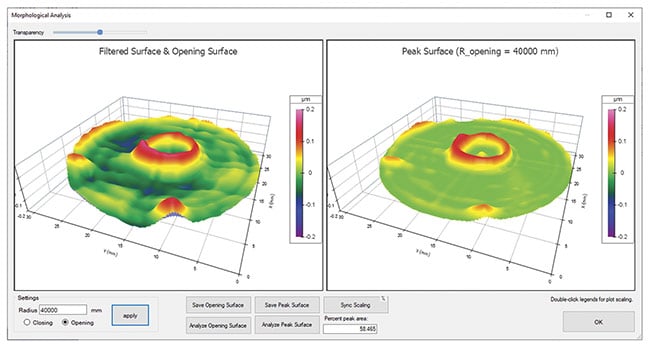
Figure 8. A morphological opening filter is applied to the surface (left). A plot shows the peaks that are sharper than the radius of the opening filter (right). Courtesy of Digital Metrology Solutions.
With so many parameters available, designers can have a tendency to attempt to control more parameters than is sensible — or possible — on the manufacturing floor. Care must be taken to specify a set of parameters that is best suited to the component’s intended function, while also being attentive to the limitations of the manufacturing processes.
Standardizing hardware, software
Measurement systems and software tend to instill a sense of absolute correctness that can, unfortunately, mask differences in settings and interpretations when measurement variables have not been sufficiently specified.
As referenced earlier, using different measurement instruments and/or analysis software at different facilities or points
in the manufacturing process can lead
to significant variability in the measurement results that control the processes. While the actual calculations should be tied to methods described in standards, equipment and software inevitably vary enough that the results are difficult to
correlate between technologies. Parameters may be available in one software package but not in another, and differences in terminology may lead to incorrect interpretations.
To reduce variability, software packages are now widely available that can analyze data from many different instruments in a standardized, recipe-driven format. Measurement procedures can be developed to achieve consistent results throughout a process. These settings can easily be exported and shared among users and facilities.
Measurement systems and software tend to instill a sense of absolute correctness that can, unfortunately, mask differences in settings and interpretations
when measurement variables have not been sufficiently specified. It is therefore imperative to maintain adequate measurement procedures and training, and to update both when new equipment or software is deployed.
Meet the authors
Mark Malburg, Ph.D., is president of Digital Metrology Solutions. With over 30 years in surface metrology, he is the chief architect of a range of standard and custom software for surface texture and shape analysis, and he is active on ASME (the American Society of Mechanical Engineers) and ISO standards committees; email: [email protected].
Mike Zecchino has been creating technical
content and resources related to optical metrology and many other industries for over 20 years. His articles have appeared in dozens
of publications, and his training materials and videos support numerous measurement instruments and technologies; email: [email protected].
Reference
1. C. Musolff and M. Malburg (2021). The Surface Texture Answer Book. Digital
Metrology Solutions.