In vivo, label-free subwavelength-resolution photoacoustic microscopy enables more precise measurement of optical absorption – and, therefore, offers more information.
Chi Zhang, Konstantin Maslov and Lihong V. Wang, Washington University, St. Louis
Mainstream optical microscopy technologies
cannot sensitively measure the optical absorption that provides essential physiological
information such as the concentration and oxygen saturation of hemoglobin.
In our research, we have implemented subwavelength-resolution
photoacoustic microscopy (SW-PAM) to provide high-optical-absorption contrast by
using a water-immersion optical objective with a 1.23 NA. SW-PAM can detect nonfluorescent
endogenous pigments in vivo with 100 percent sensitivity to optical absorption.
We found that, by imaging gold nanospheres, SW-PAM approached
the ultimate diffraction-limited optical resolution: 220 nm at a 532-nm wavelength.
We imaged ex vivo cells, including melanoma, red blood and onion epidermal, using
SW-PAM with subcellular organelles resolved. We also imaged in vivo vasculature
and early-stage melanoma with 12:1 and 17:1 contrasts, respectively, without labeling.
For all of these applications, SW-PAM showed contrasts orders of magnitude higher
than those achieved with wide-field optical microscopy, ensuring the technique as
a welcome complement to existing microscopy technologies.
Photoacoustic tomography (PAT)1 is an emerging biomedical imaging
technology that ultrasonically detects optical absorption in biological tissues.
Because of the photoacoustic effect,2 absorbed light is converted to heat and then
induces acoustic waves. PAT can work in both the optical ballistic regime (<1
mm deep) and in the diffusive regime (up to several centimeters deep), with the
same optical absorption contrast yet scalable resolution and depth.3 So far, PAT
has been successfully applied to in vivo structural, functional and molecular imaging
of biological tissues.4-9
When light is focused into biological tissue and the resulting
excited photo-acoustic signals are received by a focused ultrasonic transducer,
the localized optical absorption within the optical or acoustic focal spot –
whichever is smaller – is acquired. A high-resolution image of the tissue
then can be obtained after point-by-point scanning of the tissue. This approach
is called photoacoustic microscopy (PAM).
Although mainstream optical microscopy detects scattering (including
confocal microscopy and optical coherence tomography) or fluorescence (including
confocal and two-photon microscopy), PAM is sensitive to endogenous optical absorption
with a relative sensitivity of 100 percent,10,11 providing essential biological
functional information. Because nonfluorescent hemoglobin and melanin are major
sources of biological endogenous absorption in the visible and near-infrared spectral
ranges, PAM finds broad application in imaging tumor angiogenesis, blood oxygen
saturation and early-stage melanoma. Recently, by exciting DNA and RNA with ultraviolet
light, PAM also imaged in vivo cell nuclei without labeling.12
In optical-resolution PAM, the image resolution is limited by
the numerical aperture (NA) of the optical objective at the given wavelength. The
first optical-resolution PAM system reached a resolution of 5 μm.13 In the
past few years, the resolution has been improved for imaging of subcellular structures.
Here we describe our subwavelength-resolution PAM, which has reached the finest
diffraction-limited optical resolution.
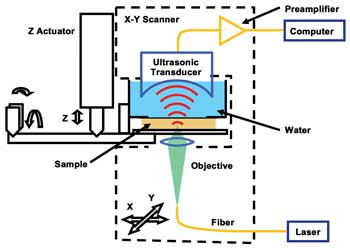
Figure 1. Schematic diagram of subwavelength-resolution
photoacoustic microscopy (SW-PAM). Reproduced with permission from Reference 15.
A system diagram of SW-PAM is shown in Figure 1.14,15 We used
a 532-nm Nd:YVO4 laser as the irradiation source. A 1.5-ns laser pulse, focused
by the 1.23-NA objective, irradiated the sample. An ultrasonic transducer with a
central frequency of 40 MHz and an NA of 0.5 received the photoacoustic waves in
transmission mode. The objective and the transducer mechanically scanned in raster
mode in the X-Y plane to obtain a 3-D image, which will be shown as a two-dimensional
maximum-amplitude projection image along the Z-axis.
We demonstrated the subwavelength resolution of SW-PAM by imaging
the gold nanospheres (Figure 2a). The nanospheres had a diameter of 15 nm and,
therefore, were ideal point absorbers to measure the point spread function of SW-PAM.
The gray values of the typical spheres in the image were fitted by the theoretical
Bessel-form function (Figure 2b). We measured the system transversal resolution
as 220 ±20 nm, given by the full width half maximum of the Bessel-form point
spread function. The theoretical resolution was calculated as 0.51 λ/NA ≈
221 nm, in good agreement with the measured value.
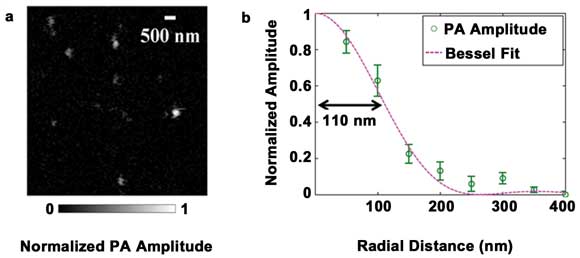
Figure 2. Measuring the transverse spatial resolution of SW-PAM.
(a) PAM image of gold nanospheres. (b) System point spread function calculated from
the gold nanospheres. Circle: the averaged pixel value. Line: the theoretical Bessel-form
function. Reproduced with permission from Reference 15.
In Figure 3, the subcellular structures are shown and the contrast
of SW-PAM is compared with that of wide-field optical microscopy. In general, the
PAM images have a dark background, while the optical microscopy images have a bright
background. Melanosomes – organelles containing melanin – appear as
bright dots (Figure 3a, left) in the PAM image, but as dark dots in the optical
microscopy image (Figure 3a, middle).
The melanosomes in the PAM image have a contrast-to-background
ratio of 54.5 ±0.4:1 and a contrast-to-noise ratio (CNR) of 49 dB, while the
optical microscopy image has a much lower contrast of 0.79 ±0.04:1 and a lower
CNR of 25 dB. This difference occurs because PAM is sensitive to absorption only,
but optical microscopy shows both absorption and scattering (the latter is relatively
close between melanosomes and other areas).
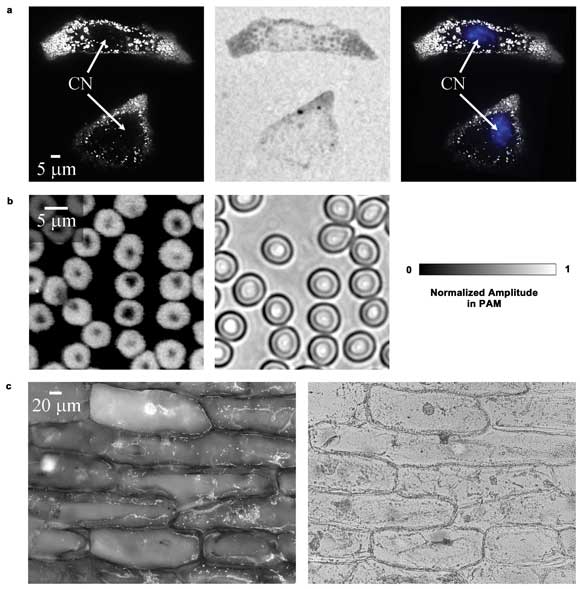
Figure 3. Ex vivo images of cells. (a) Melanoma cells imaged by PAM,
optical microscopy and PAM combined with an optical microscopy image of the blue-stained
nuclei. CN: cell nucleus. (b) PAM and optical microscopy images of red blood cells.
(c) PAM and optical microscopy images of onion epidermal cells. Reproduced with
permission from Reference 15.
In the PAM image, the dark holes inside the cells with few melanosomes
are nuclei, confirmed by staining them with fluorescent dye (Figure 3a, right).
In comparison, the nuclei in the optical microscopy image are less visible because
of the low contrast. The hemoglobin contrast disparity also can be observed by imaging
red blood cells, as shown in Figure 3b (the two images show different areas of the
cell sample). The characteristic doughnut shape of a red blood cell is clearly shown.
Moreover, rich contrasts are observed by PAM in the purple onion epidermal cells
(Figure 3c).
We also imaged the melanin distribution in a black mouse ear (Harlan
Laboratories Inc., Indianapolis, C57BL/6NHsd) in vivo with SW-PAM. We acquired two
images, focusing at ~10 and ~30 μm deep, respectively, as shown in Figure 4.
Most melanocytes reside in the basal layer of the epidermis, whose thickness is
~10 μm in this case.16 Therefore, single melanosomes can be clearly identified
in the shallower layer (Figure 4a). In the deeper layer (Figure 4b), more skin structures,
such as the sebaceous glands, are shown, but melanosomes are now out of focus.
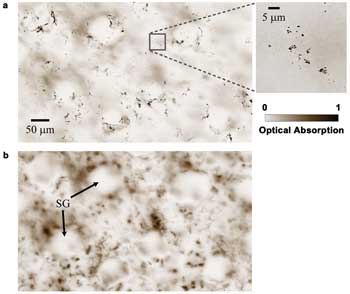
Figure 4. Melanin distribution in a black mouse ear at different depths. (a) ~10 μm
deep (the close-up image indicates melanosomes). (b) ~30 μm deep. SG: sebaceous
gland. Reproduced with permission from Reference 14.
It is worth noting that the signals from the deeper layer are
weaker, but Figure 4b appears to have higher contrast because it is scaled to the
full color range. The optical microscopy image of the ear, although not shown here,
has extremely low contrast. These results suggest potential applications of PAM
in quantifying melanin distribution in vivo, which is important for detecting melanoma
as well as determining individualized radiant exposure in dermatological laser therapies.17
The ear of a nude mouse (Harlan Laboratories, Hsd:Athymic Nude-Foxn1nu)
also was imaged in vivo. Here, we used an objective with a 0.60 NA (providing 400-nm
resolution) to extend the focal zone for the thick layer of vessels. As shown in
Figure 5a, we imaged all the blood vessels, including capillaries, with high contrast
and with few background signals. In some areas, motionless red blood cells can be
identified with the characteristic doughnut shape (Figure 5b). Next, we injected
10 μl of suspension containing 1 million B16 melanoma cells into the ear to
induce a melanoma tumor.
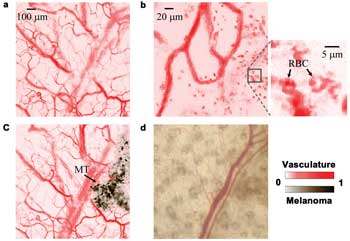
Figure 5. Monitoring melanoma growing on a nude mouse ear. (a) PAM
image of the ear before injecting melanoma cells. (b) PAM image, where
in vivo red blood cells (RBCs) can be identified (indicated in the close-up image). (c)
PAM image of the ear four days after injecting melanoma cells. MT: melanoma tumor. (d) Optical Microscopy image, in which the melanoma is obscure. Reproduced with permission from Reference
14.
We imaged the same ear again, as shown in Figure 5c, four days
later. The melanoma generated stronger photo-acoustic signals than the vessels and
was easily identified. The vasculature and melanoma had contrasts of 12 ±1:1
(33-dB CNR) and 17 ±1:1 (36-dB CNR), respectively. The contrast difference
between the vasculature and the melanoma can be further increased if the laser wavelength
is changed to, for example, 650 nm. Under wide-field optical microscopy (Figure
5d), the melanoma is obscure, with a contrast of 0.27 ±0.02:1 (21-dB CNR).
As shown by Figures 2 to 5, SW-PAM can resolve structures as small
as sub-cellular organelles, both ex vivo and in vivo. Melanoma and vasculature can
be visualized with high contrast. Therefore, SW-PAM has superior potential to detect
melanoma in the early stage, to count red blood cells as an in vivo flow cytometer
and to measure blood flow velocity in capillaries.
Moreover, although the current transmission-mode configuration
of SW-PAM limits the thickness of tissues that can be imaged, we are extending SW-PAM
to reflection mode for applications in more anatomical sites. As a result, combining
it with scaled-up macroscopy – deep-penetrating photoacoustic tomography4-18
– may bridge microscopic research and clinical practice.
Meet the authors
Chi Zhang is a graduate student, Konstantin Maslov a research
associate professor and Lihong V. Wang the Gene K. Beare Distinguished Professor
at the Optical Imaging Laboratory in the Department of Biomedical Engineering at
Washington University in St. Louis; e-mail: [email protected]. This work was
sponsored in part by National Institutes of Health grants R01 EB000712, R01 EB008085,
R01 CA113453901, U54 CA136398 and 5P60 DK02057933. Lihong Wang has a financial interest
in Microphotoacoustics Inc. and Endra Inc. Neither supported this work.
References
1. C. Li and L.V. Wang (2009). Photoacoustic tomography and sensing
in biomedicine. Phys Med Biol, Vol. 54, pp. R59-R97.
2. A.G. Bell (1880). On the production of sound by light. Am J
Sci, Vol. 20, p. 305.
3. L.V. Wang (2009). Multiscale photoacoustic microscopy and computed
tomography. Nat Phot, Vol. 3, pp. 503-509.
4. X. Wang et al (2003). Noninvasive laser-induced photoacoustic
tomography for structural and functional in vivo imaging of the brain. Nat Biotech,
Vol. 21, pp. 803-806.
5. H.F. Zhang et al (2006). Functional photoacoustic microscopy
for high-resolution and noninvasive in vivo imaging. Nat Biotech, Vol. 24, pp. 848-851.
6. L. Li et al (2007). Photoacoustic imaging of lacZ gene expression
in vivo. J Biomed Opt, Vol. 12, 020504.
7. M.-L. Li et al (2008). Simultaneous molecular and hypoxia imaging
of brain tumors in vivo using spectroscopic photoacoustic tomography. Proc IEEE,
Vol. 96, pp. 481-489.
8. J. Laufer et al (2009). Three-dimensional noninvasive imaging
of the vasculature in the mouse brain using a high resolution photo-acoustic scanner.
Appl Opt, Vol. 48, pp. 299-306.
9. Y. Wang et al (2011). In vivo integrated photoacoustic and
confocal microscopy of hemoglobin oxygen saturation and oxygen partial pressure.
Opt Lett, Vol. 36, pp. 1029-1031.
10. L.V. Wang and H. Wu (2007). Biomedical Optics: Principles
and Imaging. John Wiley & Sons Inc., Hoboken, N.J., pp.3-8.
11. L.V. Wang (2008). Tutorial on photo-acoustic microscopy and
computed tomography. IEEE J Sel Topics Quantum Electron, Vol. 5, pp. 171-179.
12. D.-K. Yao et al (2010). In vivo label-free photoacoustic microscopy
of cell nuclei by excitation of DNA and RNA. Opt Lett, Vol. 35, pp. 4139-4141.
13. K. Maslov et al (2008). Optical-resolution photoacoustic microscopy
for in vivo imaging of single capillaries. Opt Lett, Vol. 33, pp. 929-931.
14. C. Zhang et al (2010). Subwavelength-resolution label-free
photoacoustic microscopy of optical absorption in vivo. Opt Lett, Vol. 35, pp. 3195-3197.
15. C. Zhang et al (2011). Subwavelength-resolution photoacoustic
microscopy for label-free detection of optical absorption in vivo. Proc SPIE 7899,
p. 78990L.
16. K. Kietzmann et al (1990). The mouse epidermis as a model
in skin pharmacology: influence of age and sex on epidermal metabolic reactions
and their circadian rhythms. Lab Animal, Vol. 24, pp. 321-327.
17. W. Verkruysse et al (2009). Remittance at a single wavelength
of 390 nm to quantify epidermal melanin concentration. J Biomed Opt, Vol. 14, p.
014005.
18. M.P. Fronheiser et al (2010). Real-time optoacoustic monitoring
and three-dimensional mapping of a human arm vasculature. J Biomed Opt, Vol. 15,
p. 021305.