IR spectroscopy was once limited to sensing molecular vibrational absorption for chemical specificity. Now, IR spectroscopy-based photothermal microscopy is finding broader uses.
DELONG ZHANG, YERAN BAI, AND JI-XIN CHENG, BOSTON UNIVERSITY
Current bioanalysis largely relies on tissue homogenization and separation, followed by various assays. Without spatial and temporal dynamics information, the way in which molecules execute their functions in a living system remains unknown.
Currently, there exists a highly sensitive, high-speed chemical imaging platform technique based on visible beam sensing of the thermo-refractive effect of IR absorption. With molecular fingerprint information, micromolar sensitivity, and nanoscale spatial resolution, this platform is able to map drug distribution in a pharmaceutical formulation and metabolic activities inside a living cell.
More than a century ago, IR spectroscopy was established to sense molecular vibrational absorption for chemical specificity. Today, microscopy technology based on IR spectroscopy has been widely used in studies ranging from chemical analysis to biomedical samples. However, fundamental limitations hinder the application of direct IR absorption-based imaging: The spatial resolution is poor, limited to several micrometers due to long excitation wavelengths; there is no depth resolution; and it cannot apply to living systems due to water absorption.
To tackle such limitations, a newly developed advanced IR imaging platform — mid-infrared photothermal (MIP) microscopy — probes the IR absorption-induced thermal lensing effect using a visible laser beam1. The absorption of the modulated IR beam (pump) induces a local temperature change. The temperature gradient around the focusing area is then formed as the refractive index gradient. The propagation direction of the visible beam (probe) is changed because of the lensing effect, and the signal is exacted by detecting the intensity change of the probe beam with a photodiode (PD) and a lock-in amplifier. Sharing a similar concept, advanced photothermal IR spectroscopy also has been demonstrated2,3.
The MIP microscope comprises an IR beam and a visible beam, a reflective objective, and a typical microscope frame (Figure 1). MIP imaging can be done in either transmission mode for transparent samples, or in a backward-detected epi-mode for nontransparent samples (Figure 1, inset). The spectra can be acquired by sweeping the IR laser wavelengths. A spatially resolved chemical map can be acquired by scanning the sample. Other than the co-propagation scheme (pump and probe propagate in the same direction), counter-propagation (pump and probe propagate in the opposite direction) has also been reported5.
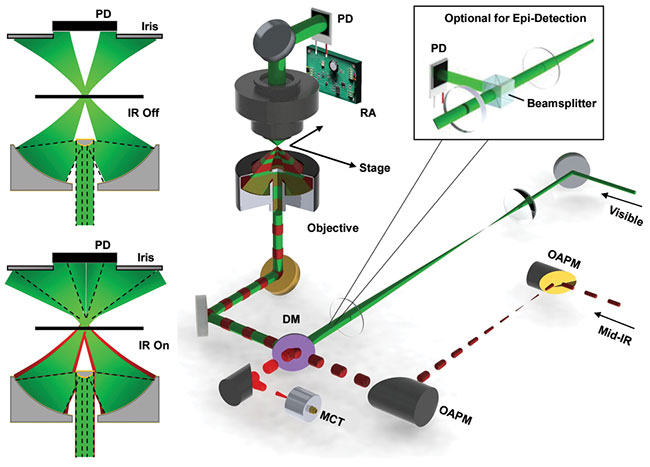
Figure 1. The propagation of the visible beam (probe) is perturbed by the thermal lens effect induced by the absorption of the pulsed MIR (pump) beam. Image contrasts are created by detecting the probe beam intensity change. Inset shows a depiction of the modification for a backward-detected (epi-) scheme. PD: photodiode; RA: resonant amplifier; DM: dichroic mirror; MCT: mercury cadmium telluride; OAPM: off-axis parabolic mirror. Adapted from references 1 and 4/American Association for the Advancement of Science.
The agreement between the MIP spectrum and standards demonstrates the spectral fidelity for both liquid and solid samples. The sensitivity of MIP imaging has been evaluated by measuring the 1775 cm-1 C=O bond vibration of a small molecule (γ-valerolactone) in a carbon disulfide solution. The detection limit in terms of molar concentration was found
to be 10 μM, with an IR power of only 2 mW and a probe power of 10 mW at the sample. This sensitivity is beyond the reach of current Raman scattering-based vibrational microscopes.
To check the spatial resolution of MIP microscopy, a 500-nm poly(methyl methacrylate) bead was imaged. The measured full width at half maximum (FWHM) was 0.63 μm in the X direction and 0.61 μm in the Y direction. In comparison, the diffraction limit of a 1730 cm-1 IR beam with the same NA objective (0.65) is 5.5 μm, which is theoretically the best resolution achievable by an IR microscope. The ninefold improvement in spatial resolution by MIP microscopy offers the opportunity for unveiling subcellular structures in living cells (Figure 2).
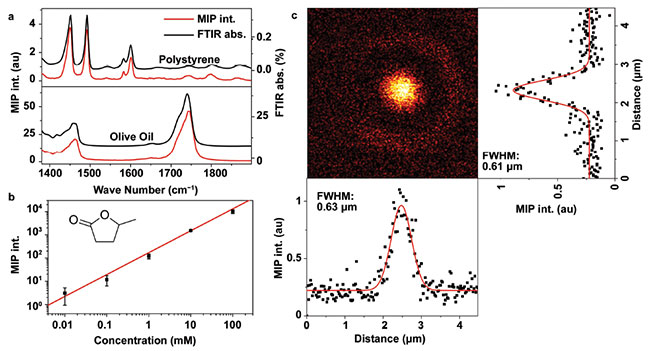
Figure 2. Performance of a mid-infrared photothermal (MIP) microscope. Spectral fidelity (a): comparison of MIP spectral profiles (red) and FTIR spectra (black) of polystyrene film (top) and olive oil (bottom). Sensitivity (b): MIP signal of γ-valerolactone in carbon disulfide at various concentrations. Inset shows the molecular structure. The limit of detection is found to be 10 μM when the SD is equal to the solution-solvent difference. Spatial resolution (c): MIP imaging of a 500-nm PMMA bead. The horizontal and vertical intensity profiles are plotted at the bottom and the right side of the image. The measured FWHM is 0.63 and 0.61 μm, respectively. Pixel dwell time is 5 ms. Adapted from reference 1.
Subcellular MIP mapping of lipid droplets (LDs) and membranes in a cancer cell is demonstrated in Figure 3. LDs in cancer cells play an important role in determining the metabolic processes. LD distribution within single cancer cells can be clearly seen and the individual droplet is well resolved. By changing to different focusing depth, sectioning images are recorded and 3D lipid droplets mapping within a single cell is reconstructed (Figure 3c).
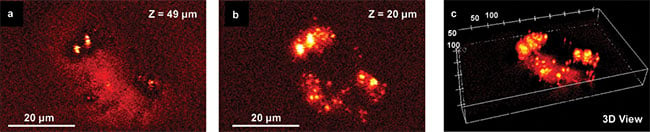
Figure 3. Depth-resolved, live-cell MIP imaging at submicrometer spatial resolution. MIP imaging of a cancer cell at different depths are shown in (a), (b), and 3D reconstruction (c). The IR beam was tuned to 1750 cm−1 targeting C=O band. Adapted from reference 1.
The much-improved spatial resolution in MIP microscopy boosts the applications of IR spectroscopy. By imaging at characteristic IR peaks of target molecules, the concentration distribution can be extracted across the imaging area based on the spectroscopic signatures. For example, the anticancer drug JZL184 was administered to the MIA PaCa-2 cancer cells. MIP imaging of the live cells was done at wave numbers 1380, 1400, 1480, 1700, 1720, 1724, 1750, 1800, and 1850 cm-1.
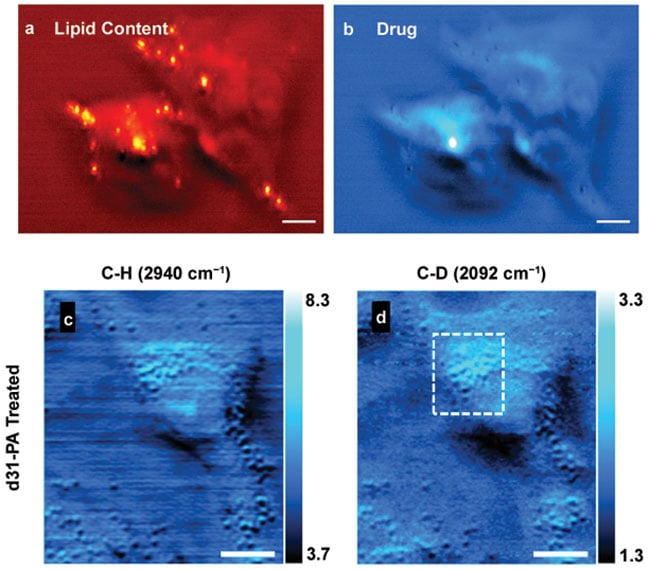
Figure 4. MIP imaging of drugs and metabolites in living cells. MIP imaging of cellular drug uptake in JZL184-treated MIA PaCa-2 cells of lipid and drug contents, respectively (a, b). High wave number MIP image of A549 lung cancer cells treated with deuterated palmitic acid, d-PA (c, d). C-H rich lipid and protein contents were visualized by the 2940 cm-1 MIP image (c). The image at C-D band reveals the fatty acid metabolites (d). Scale bars: 20 µm in a, b; 10 µm in c, d. Adapted from references 1 and 7.
By analyzing with multivariate method6, the drug content showed a clear difference from the intrinsic C-H rich contents (Figures 4a, 4b). Furthermore, single bacteria imaging has been demonstrated by the Hartland group5. When the target molecules have similar spectral profile to that of endogenous species, isotope-labeled molecules could be used because their characteristic peaks appear at a spectrally silent region. We treated and imaged cancer cells (A549, lung cancer) with deuterated palmitic acid (d31-PA), in which all hydrogen atoms were replaced with deuterium (Figures 4c, 4d). The C-D vibrational peak showed up at around 2100 cm-1 — no intrinsic spectral peaks reside in this region. MIP imaging at the C-H and C-D wave numbers revealed the intrinsic and externally treated contents, respectively, at new insights of metabolism in live cells.
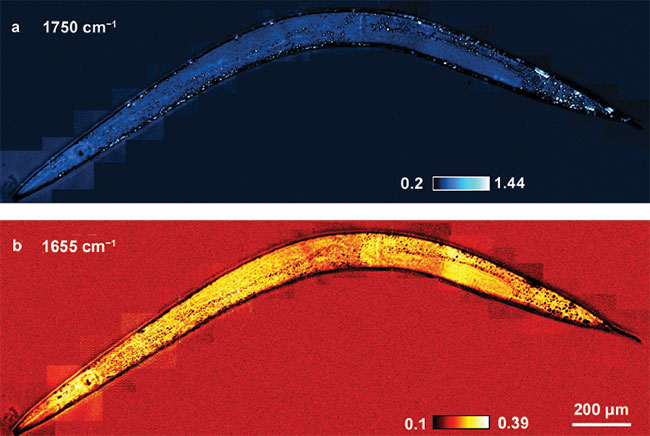
Figure 5. In vivo MIP imaging of lipid and protein in Caenorhabditis elegans. MIP imaging of the worm body at the 1750 cm-1 lipid C=O band (a). MIP imaging of the same area at the 1655 cm-1 protein amide I band (b). Adapted from reference 1.
MIP microscopy also has been demonstrated in live organisms1 and tissue slices8,9. For example, Caenorhabditis
elegans (anesthetized) was used for whole-body imaging at wavelengths of 1750 cm-1 for lipids and 1655 cm−1 amide I band for protein contents (Figure 5). The chemical maps showed different contrast, where individual lipid droplets were visible. The ubiquitous protein contents were found throughout the body. The results of this study demonstrate the depth resolution of MIP microscopy, given the nature of a pump-probe detection scheme.
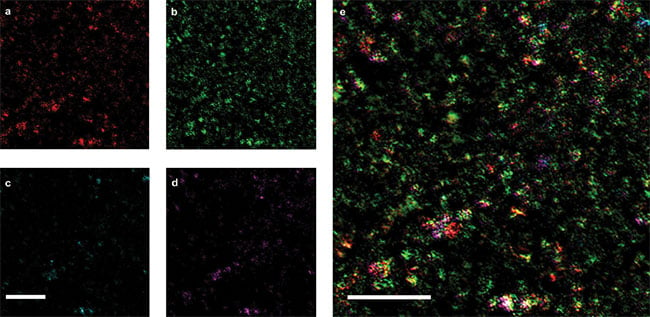
Figure 6. Epi-MIP image of API and excipients in a Tylenol tablet. Epi-MIP images obtained at 1413, 1502, 1656, and 1750 cm-1, which correlate to corn starch, acetaminophen (API), PVP, and SSG, respectively (a, b, c, d). Overlaid image of a-d showing the distribution of API (green), corn starch (red), PVP (cyan), and SSG (magenta) (e). Pixel dwell time: 1 ms. Scale bars: 50 μm. Adapted from reference 4.
MIP microscopy in the backward-detected (epi-) mode has the capability of imaging nontransparent samples. Epi-MIP mapping of active pharmaceutical ingredients in a Tylenol tablet at 1413, 1502, 1656, and 1750 cm-1 are shown in Figure 6. These peaks correspond to corn starch, acetaminophen (API), polyvinylpyrrolidone (PVP), and sodium starch glycolate (SSG), respectively. Each substance demonstrates a unique spatial distribution and dosage in the region. By merging what is shown in Figures 6a and 6d, the overlaid image exhibiting the relative distributions of the four substances in the Tylenol tablet was obtained. Most of the bright spots contained more than one molecule, which implies that API and excipients were fully mixed before the tablet compression process.
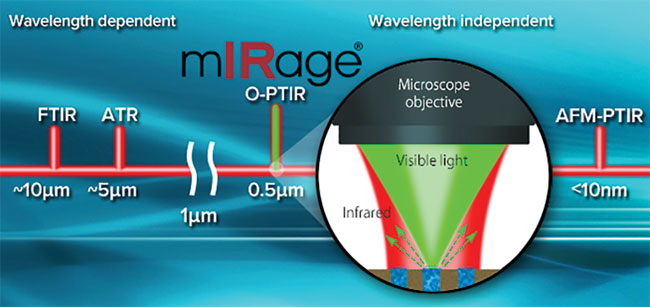
Figure 7. An MIP microscope fills a gap between Fourier transform (FT)-IR spectroscopy and atomic force microscopy (AFM)-IR, which combines atomic force microscopy and IR spectroscopy. O-PTIR: optical photothermal IR; AFM-PTIR: AFM-photothermal IR. Courtesy of Roshan Shetty/Photothermal Spectroscopy Corp.
A highly sensitive chemical microscope has been developed by detecting the photothermal effect of MIR absorption. By providing submicron spatial resolution depth sectioning and epi-detection in a noncontact mode, the reported MIP microscope fills a gap between Fourier transform (FT)-IR spectroscopy and atomic force microscopy (AFM)-IR, which combines atomic force microscopy and IR spectroscopy (Figure 7).
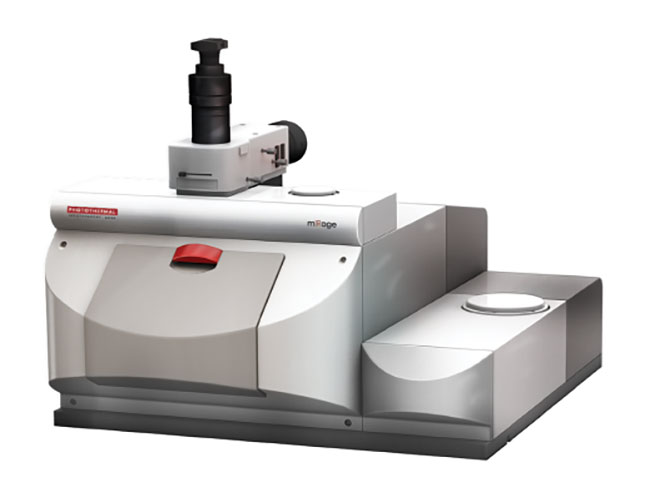
Figure 8. A mIRage IR microscope. Courtesy of Roshan Shetty/Photothermal Spectroscopy Corp.
Future studies will target more chemical bonds, such as C=O, C-H, and N-H, to generate multispectral photothermal images that can decompose to lipid, cell membranes, and other biomolecules. Notably, the MIP technology has been converted into a turnkey product — the mIRage IR microscope (Figure 8, p. 38) by Photothermal Spectroscopy Corp. — which will allow broad use of photothermal IR to tackle problems in functional materials, life sciences, and medicine.
Meet the authors
Delong Zhang, Ph.D., is a postdoctoral associate at the Photonics Center of Boston University. He has a bachelor’s degree in chemical physics from the University of Science and Technology of China, and a doctorate in analytical chemistry from Purdue University; email: [email protected].
Yeran Bai is a Ph.D. candidate at the Shanghai Institute of Optics and Fine Mechanics at the Chinese Academy of Sciences. She is currently a visiting scholar in Boston University professor Ji-Xin Cheng’s lab. Bai’s work focuses on MIR photothermal spectroscopic imaging; email: [email protected].
Ji-Xin Cheng, Ph.D., is the Moustakas Chair Professor in the Department of Electrical and Computer Engineering/Biomedical Engineering at Boston University. He has a doctorate in physical chemistry from the University of Science and Technology of China; email: [email protected].
References
1. D. Zhang et al. (2016). Depth-resolved, mid-infrared photothermal imaging of living cells and organisms with submicrometer spatial resolution. Sci Adv, Vol. 2, Issue 9 (e1600521).
2. A. Mertiri et al. (2014). Nonlinear midinfrared photothermal spectroscopy using Zharov splitting and quantum cascade lasers. ACS Photonics, Vol. 1, Issue 8, pp. 696-702.
3. A. Totachawattana et al. (2016). Vibrational mid-infrared photothermal spectroscopy using a fiber laser probe: asymptotic limit in signal-to-baseline contrast. Opt Lett, Vol. 41, Issue 1, pp. 179-182.
4. C. Li et al. (2017). Mid-infrared photothermal imaging of active pharmaceutical ingredients at submicrometer spatial resolution. Anal Chem, Vol. 89, Issue 9, pp. 4863-4867.
5. Z. Li et al. (2017). Super-resolution far-field infrared imaging by photothermal heterodyne imaging. J Phys Chem B, Vol. 121, Issue 37, pp. 8838-8846.
6. D. Zhang et al. (2014). Fast vibrational imaging of single cells and tissues by stimulated Raman scattering microscopy. Acc Chem Res, Vol. 47, Issue 8, pp. 2282-2290.
7. Y. Bai et al. (2017). Bond-selective imaging of cells by mid-infrared photothermal microscopy in high wavenumber region.
J Phys Chem B, Vol. 121, Issue 44, pp. 10249-10255.
8. A. Mertiri et al. (2014). Label free mid-IR photothermal imaging of bird brain with quantum cascade laser. CLEO: Applications & Technology, The Optical Society.
9. A. Totachawattana et al. (2015). Optimization of mid-IR photothermal imaging for tissue analysis. Ultrafast Nonlinear Imaging and Spectroscopy III, SPIE, Vol. 9584.